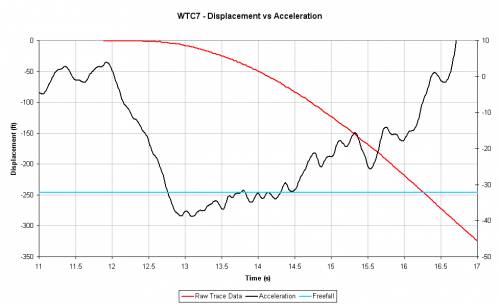
"LMAO", indeed.
You're "graphically illiterate". And now you appear to have crossed a line that I hadn't seen you cross before: into fraudulence.
And for what? To win some stupid, insignificant point…?!
ROFL. A close-up...
You will notice that all of the data in the time segment of the graph you are "questioning" is below the zero line in the graph above.
You post this data as though the red line represents the same data posted in the previous graph.
And yet, it clearly is not.
That's fraudulent.
In the new graph, between 11.4 & 11.7 seconds, the data oscillates around a median of about -1.1 ft. Between 11.8 & 12.3, it oscillates around a median of about -0.8 ft.
And yet, in the graph under discussion, there is a clear & obvious red line shown between 11.8 seconds and 12.3 seconds (for the smaller absolute value), and no line between 11.4 & 11.7 sec (for the larger absolute value).
Computers don't make this sort of error.
If this were the same raw data, and the cause were merely pixel averaging, then the situation would have been reversed: a line between 11.4 & 11.7 sec, and no line between 11.8 & 12.3 sec.
The only explanation is that the original graph is filtered data and the graph that you posted as "a blow up of the same data" is either unfiltered, or differently filtered data.
In other words, it's not the same data, merely enlarged.
In other words, you chose to intentionally mislead, to not post a blow up of the same data, but to swap the data to win a debating point.
In other words, you lied.
Your credibility is in a uncontrolled dive.
You will note that none of the data is anywhere near +10, nor is any of the data after the 3s mark above zero.
You're illiterate.
Try reading what I wrote again. Feel free to mouth the words, if that helps. A dictionary might be a useful tool, as well.
Show me anywhere that I said the data reached +10. You won't find it. Because I never suggested it.
Now try setting the maximum value of your graph to 1, or 2, or 3, or 5, etc.
Then try setting it to +10.
Notice the difference in the vertical scale numbers.
Given that you have the data it is abundently clear that you are deliberately making up crap.
What is abundantly clear is that you are both graph illiterate & English illiterate.
I guess consistency could be considered an asset…
ROFL. What filtering, tfk ? (There is a process applied to the data, which you should know, but I'd still class the data as raw.)
You really look pretty damn stupid, rolling around on the floor after brain-dead comments like this.
A "process is applied to the data"…
Yeah, a process called "a filter".
Which means - BY DEFINITION - that the result is NOT "raw data".
So, what filtering, tfk ?
LoL. The filtering that you applied to the raw data, ya liar.
Not a mistake in the slightest. Believe it or not the "acceleration of gravity" is constant in a particular location, for all time (cosmic events notwithstanding)
Yup, G is a constant. Nobody with a double digit IQ has suggested otherwise. Ergo, it is single-digit IQ-worthy to publish that worthless little factoid.
An interesting & potentially meaningful point would be how some point on the building really fell compared to a point on a building that really fell at free fall.
But, then again, you & "meaningful" seldom cross paths, do ya.
The reason for its inclusion should be obvious for anyone of modest intellect.
Yep, it is abundantly clear.
You don't know how to present data in a meaningful manner.
You probably don't know how to generate a step function in Excel either.
North Wall ? ROFL. Have you not learned anything from previous discussions ? The data is for the NW corner, not the entire north wall.
Yeah, I (and just about everyone else) has learned that you are utterly incompetent at labeling your graphs. If someone doesn't understand your graphs because you don't label them, you've got nobody but yourself to blame. If you knew the slightest thing about publishing tech data, you'd know that.
Furthermore, have you not learned that people who DO understand chart & graphs & numbers & engineering (i.e., people who work with them professionally, on a daily basis, people like me) don't give a flying fart about your meaningless graphs.
Precisely because you are so abysmally incompetent at presenting anything. Augmented by the fact that you are so intentionally deceptive.
Your credibility fell at supersonic speed.
NIST make that same inept mistake when they assert their poor quality trace data applies to the entire north wall, not just the wandering point around the roofline area they traced.
You will, of course, present NIST's own words where they make this error.
Of course.
femr's intentional deceptive quote-mine said:
You know exactly what is wrong with that label
ROFL. How very petty. Good back-pedal though
Perfect example of your misquote, twisting words, aka "lying".
Meanwhile, the point of my post - that you don't what the hell a "displacement vs. acceleration" graph looks like.
Care to hazard a guess?
Or are you just going to dance, and dance, and dance…?
___
As to your ability to read your own data …
tfk said:
Your graph shows >g acceleration for virtually the entire time between 12.75 & 14.3 seconds. With a momentary sub-g excursion around 13.75 seconds.
If you're applying zero error potential. I'd suggest 12.75s to 13.75s is a more reasonable over-g estimation.
"… applying zero error potential" ??
"… APPLYING ZERO ERROR POTENTIAL"????

Does that techno-gibberish sound all science-y to you?
I will HAPPILY accept this statement of yours as a demonstration of your ability to assess ANY technical issue.
The fundamental difference between what we are saying is that I said that your graph states over-g acceleration between 13.75 and 14.3 seconds.
And your claim that the over-g acceleration stops at 13.75 seconds.
Yup, I'll accept that as a demonstration of your ability to read graphs.
It's no wonder that your so totally incompetent at all of this.
Incompetent as a result of your "applying zero error potentials", no doubt…