Near freefal collapse speed

If this is the graph for building 7, Chris Mohr did a pretty compelling presentation and explanation for the brief period of greater-than-freefall acceleration observed by NIST.

You can find it on YT. it's like video 15, 16, or 17 or so.

Worth watching.
 
I agree that you did not swap the data sets.
About time.

I note you skip over your silly prior accusations...
tfk said:
I understand the little deception you play to hide scatter in the displacement data
I assume you now "understand" that all of the data during the interval displayed is below the zero line, and so zero deception was performed, simply your continnued unfamiliarity with the data (that's the trace data, not your attempt to side-step some of your other assertions by suggesting the only "data" is the original video images, despite referring to all manner of other "data" :rolleyes:)

tfk said:
I understand the mistake that you make in setting the acceleration of gravity to -32.2 ft/sec^2 for all time.
No mistake. I understand that "the acceleration of gravity" is, in fact, pretty much constant.

The reason you had difficulty was the following incorrect assumption...
tfk said:
The graph is supposed to be comparing the acceleration that the north wall would have had if it collapsed at free fall.

I assume you now "understand" where your assumption went astray.

In other words, you chose to intentionally mislead, to not post a blow up of the same data, but to swap the data to win a debating point.

In other words, you lied.

Your credibility is in a uncontrolled dive.
As you appear to have fathomed, your assertion above is incorrect.

tfk said:
The fundamental difference between what we are saying is that I said that your graph states over-g acceleration between 13.75 and 14.3 seconds.

And your claim that the over-g acceleration stops at 13.75 seconds.
Yup. I don't think the data is accurate enough to state that the period after 13.75s is actually over-g, rather than AT-g or even slightly under-g.

Interpretation with limits of the graph kept in mind is always wise.

About 1s over-g I'd still say.

 
Seriously, what in the world could the following graphic accomplish? Who would post this and for what reason?
Your local software has corrupted the animated GIF provided to you. That you have the wrong setting in your local image tool is not my problem.

The only person who has posted "the following graphic" is you, and I assume the reason is that you want help working your local image program ? If not, then...
 
About time.

I note you skip over your silly prior accusations...

I assume you now "understand" that all of the data during the interval displayed is below the zero line, and so zero deception was performed, simply your continnued unfamiliarity with the data (that's the trace data, not your attempt to side-step some of your other assertions by suggesting the only "data" is the original video images, despite referring to all manner of other "data" :rolleyes:)


No mistake. I understand that "the acceleration of gravity" is, in fact, pretty much constant.

The reason you had difficulty was the following incorrect assumption...


I assume you now "understand" where your assumption went astray.


As you appear to have fathomed, your assertion above is incorrect.


Yup. I don't think the data is accurate enough to state that the period after 13.75s is actually over-g, rather than AT-g or even slightly under-g.

Interpretation with limits of the graph kept in mind is always wise.

About 1s over-g I'd still say.

DeadHorse.jpg
 
Last edited by a moderator:
Your local software has corrupted the animated GIF provided to you. That you have the wrong setting in your local image tool is not my problem.

The only person who has posted "the following graphic" is you, and I assume the reason is that you want help working your local image program ? If not, then...


If you are trying to educate it is your problem if your method is not working for your intended audience. Make a youtube video:rolleyes:
 
No, the data was generated by femr.

The data is good.
Agreed ! :)

However, what happened to your prior assertions about "the data" being, and only being "the source video" ?

I suggest you simply move on from that one though. Endless pointless argument about "what does data mean" would be less than boring.

The interpretation of the data is where the fur starts to fly.

I'll tell you mine. (Good luck at getting femr to tell you his.)
I've provided my views on the over-g behaviour numerous times in the appropriate thread.
 
If this is the graph for building 7, Chris Mohr did a pretty compelling presentation and explanation for the brief period of greater-than-freefall acceleration observed by NIST.
NIST did not manage to identify, let alone explain, the period of likely over-g acceleration of the NW corner, partly because they didn't look at the NW corner.
 
NIST did not manage to identify, let alone explain, the period of likely over-g acceleration of the NW corner, partly because they didn't look at the NW corner.
Thank goodness they did not waste time inventing how to study one point on a building. What a waste of time.

They did not have to, it serves no purpose since the center of gravity of the mass, the entire building never exceeded g.

It is silly to study one point of the collapse, when the key collapse was internal. Like the old tale of blind men investigating an elephant.
 
Last edited:
NIST studied one (wandering, meandering) point on the building.
See above :rolleyes:
The classic, "See above", with a funny face. Yep, NIST failed to waste time and money on nonsense. What is new? NIST does not have to answer the crasy idiotic claims of 911 truth nuts.

And your point? Got a point? No

The video is enough to see the dynamics of the visible building facade collapse. The internal failure, the key to WTC 7 demise is hidden by the outside. So?

NIST made no big deal out of what you smooth with the wrong filter. What is the high frequency noise removed by a filter picked at random using google? That looks good, ... lol

Why did NIST not waste time on nonsense? Because it has no purpose. But if it did, you would clearly state the purpose, goal, and make come conclusions past NIST didn't do this and that. The old NIST bashing cause tech paper failed scam, and the inside job ideas failed to materialize.

Not near free fall collapse of WTC 7; how did 911 truth fool so many fringe followers to say "free-fall", or the classic, "at free-fall speed"?

Did WTC 7 as a system fall at acceleration greater than g? No. Do you have to study a point to know this? No. Was WTC a target of the terrorists? No.

Do buildings fail in fires not fought? Yes, they are usually totaled. Not sure how 911 truth fooled a fringe few.

Now Major Tom will have something to post about.

I see the "near freefall" collapses of the towers are still seen by some as indication for a Controlled demolition.

i once believed the same.
But Gregory Urichs short paper about it and me watching several collapses compared to CD's convinced me, it is no indication at all.

most CD's do merely start a progressive collapse that is driven by gravity.

but we still see WTC being compared to CD videos.
have any truther done any work on this to show that the collapse speed can indicate a CD?
How can CD could be indicated by collapse speed since CDs use gravity to do the major destructive work. E=mgh is released in CD by various methods to do the destructive work in CD.
Thus CDs are gravity collapses, and there is no difference except in initiation.
CD would have blast effects; no blast effects on 911.
CD would have sounds of explosives; no sounds on 911.
ETC.
 
The video is enough to see the dynamics of the visible building facade collapse. The internal failure, the key to WTC 7 demise is hidden by the outside. So?

IIRC, seismograph readings indicate that internal collapse started ~5 seconds before the fall of the east penthouse. Then, another 5-6 seconds before the west penthouse and the outer shell begin to fall. So, most of it is not discernible from videos.
 
IIRC, seismograph readings indicate that internal collapse started ~5 seconds before the fall of the east penthouse. Then, another 5-6 seconds before the west penthouse and the outer shell begin to fall. So, most of it is not discernible from videos.

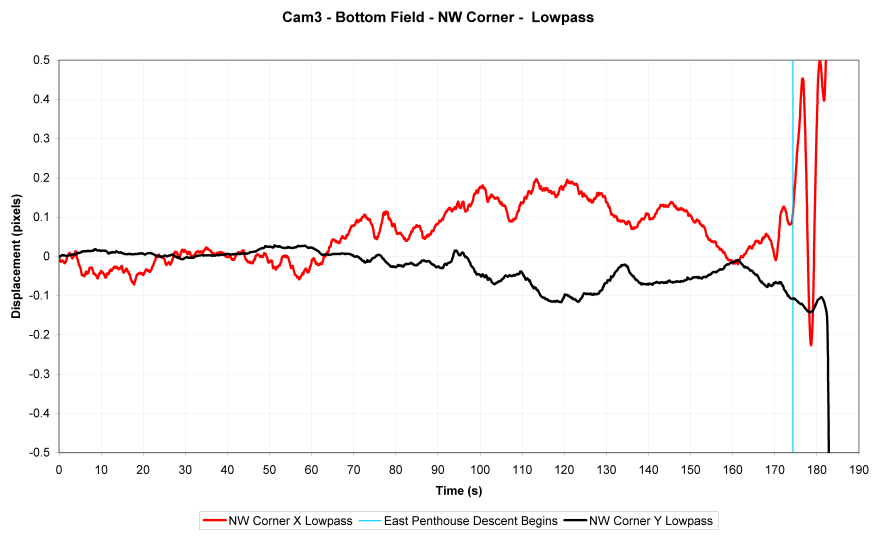
Trace data indicates...

666377698.png


a) Significant change in building motion (NW corner) 15s prior to EPH release.

b) Early building motion nearly 2 minutes prior to EPH release.


The video record, in conjunction with high precision tracing methods, is more revealing about actual building motion than any interpretation of seismic data could provide.

So, you may be surprised about what can be discernable from videos.
 
Yeah, I (and just about everyone else) has learned that you are utterly incompetent at labeling your graphs. If someone doesn't understand your graphs because you don't label them, you've got nobody but yourself to blame. If you knew the slightest thing about publishing tech data, you'd know that.

Furthermore, have you not learned that people who DO understand chart & graphs & numbers & engineering (i.e., people who work with them professionally, on a daily basis, people like me) don't give a flying fart about your meaningless graphs.

Does this mean you need to be a professional to avoid falling into the trap of trutherism?
 
Last edited:
NIST studied one (wandering, meandering) point on the building.

Can you explain why they should have explained this over G and what would be gained (given the scope of their work)? They did later explain how multi-story buckling could cause this but, at that point most engineers had already figured this out.
 
Last edited:
Originally Posted by Redwood
IIRC, seismograph readings indicate that internal collapse started ~5 seconds before the fall of the east penthouse. Then, another 5-6 seconds before the west penthouse and the outer shell begin to fall. So, most of it is not discernible from videos.


Trace data indicates...

[qimg]http://femr2.ucoz.com/_ph/7/666377698.png[/qimg]

a) Significant change in building motion (NW corner) 15s prior to EPH release.

b) Early building motion nearly 2 minutes prior to EPH release.


The video record, in conjunction with high precision tracing methods, is more revealing about actual building motion than any interpretation of seismic data could provide.

So, you may be surprised about what can be discernable from videos.


So, we have indications of building instability 2 minutes before visible signs of collapse, right? (I'm just a dumb retired chemist, not an engineer.) Then we have stronger evidence of instability 15 seconds before, and a seismographic spike indicating initiation of internal collapse, a few seconds before external signs of collapse?

In your opinion, is there anything in this which is inconsistent with structural failure due to fire? Anything which would indicate deliberate destruction by any other means, including, but not limited to, explosives?
 
So, we have indications of building instability 2 minutes before visible signs of collapse, right?
Correct.

Then we have stronger evidence of instability 15 seconds before
Correct.

In your opinion, is there anything in this which is inconsistent with structural failure due to fire? Anything which would indicate deliberate destruction by any other means, including, but not limited to, explosives?
Such behaviour certainly refutes any suggestion of an Event->Immediate descent type scenario...a point I have made many times (though not to yourself...just a pointer for others here who have a rather bizarre perspective of my purpose).

Though not a clear creep type behaviour (more a flexure of the building) similar techniques have indicated creep type motion for WTC1 >9s prior to release...which again precludes all Event->Immediate descent type scenarios.
 

ISF - Join now!

Every member here is approved by hand. No bots, no spam, just people who care about evidence and honest debate.

Membership is free!

Create your free account

Back
Top Bottom