Merged Thread to Discuss The Excellent Analysis of Jones latest paper

Here is an interview (Part 2/3) with Niels Harrit from July 2009 which I had not seen before, making a statement about active and dead chips:
http://www.youtube.com/watch?v=9yrMIhVq-G0
Niels Harrit said:
[1:24]It takes some experience to find the active particles. Some of them are dead, some of them are active.
And he goes on to speculate that perhaps exposure to water is one way to deactivate chips.

A bit further in the interview, he talks about how NIST has heated steel columns and found that the Tnemec primer was "stable". Which kind of raises the question: Why did it not occur to Harrit that perhaps some of the "dead" chips could be Tnemec primer?


And this raises the questions:

  • Did they study dead chips?
  • Are they different, by morphology or elemental spectrum, from active chips?
  • If yes: by what criteria can the dead chips be distinguished from the active chips? Did they apply these criteria before doing further studies on chips a-d, the MEK-chip, the multilayered chip or the chip whose resistivity is 10 ohm-m?
  • If not: How did they make sure that the chips a-d, the MK-soaked chip, the multilayered chip or the chip whose resistivity is 10 ohm-m were active? Did they ignite them afterward?
 
Oystein: Considering just Tnemec and Laclede primer paints, we could guess that Tnemec might be the material which is "dead" one for Harrit, since it contained considerably less of combustible polymer binder. On the other hand, it contained considerably more of strongly oxidizing chromate (zinc chromate), which can perhaps contribute to the speed of polymer oxidation/burning...
 
Ivan,

I am not sure that dry Tnemec "contained considerably less of combustible polymer binder". The fact is, we don't know what the pigment:binder ratio is in that paint, but I think it can't be too far from the 28.5:71.5 ratio in LaClede - after all, it needs to be sufficiently viscous to be applied. The Tnemec pigments contain 36% iron oxide, the LaClede pigments 55%. One could guess that a similar density of red pigments might be a reasonble expectation, on the other hand, if LaClede can do with only 4% chromates in the pigment, and Tnemec needs 20%, one could with similar reason expect less pigment per binder mass unit. The proprietary portion of the pigments seems to be mostly filler - talc, silicates, aluminates, and thus plays, together with silica, the role of kaolin in LaClede. LaClede pigments are 41% filler, Tnemec pigments is 44% filler. LaClede is 59% color pigments, Tnemec is 56% color pigments. To get comparable cover and color intensity, this would speak for a similar pigment:binder ratio. Finally, my simulations of "contaminated Tnemec", and comparison with Jones's Tnemec sample, suggests a ratio of 61.6:38.4 - but I have lately grown more aware of The Almond's warning a long time ago that simulating C and O is a den of snakes, because peaks could be off by factors as high as 2.

Secondly, Tnemec isn't necessarily "dead" - depends on your definition of "dead". I am pretty sure it does react under 600 °C, just doesn't burn outright with an obviousl flame. Probably decomposes somewhat. It's just that it maintains cohesion rather than turning to ashes. And it stays red, because the iron oxide doesn't stay red. I have no doubt that at the time the formation of scales and the scaling sets in (650 °C, iirc), it's mass is already depleted.
Of course the same may apply to "dead" chips: That they don't burn with a flame, just decompose quietly and more slowly than the epoxy chips.

Another idea: That some of the red chips were from the fire zones where they already has experienced some heat (under 600 °C), causing them to partially decompose. Such chips would not react much when heated again to the same temp. Such chips could be expected to spall off more easily and more abundantly during the collapse. The chip in Fig. 32 and 33, with the carbon layer between iron oxide and red layer, could be such an example?
 
Oystein: OK, my guess that Tnemec contained considerably less of polymer binder was... no more than guess. I basically "derived" that my guess from the XEDS of Tnemec provided by S. Jones, in which carbon peak is low, but I should bear more in my mind how these "carbon data" are treacherous.

Otherwise, I agree: Harrit's "dead chips" can be those who just decompose "quietly", without flame. Of course, no paint chip with organic polymer binder can be really "dead" (non-reacting under air at high temperatures), this is a thing which I've repeated here x-times. Polymer binder is always combusted with some exothermic effects and does not basically exist anymore at temperatures above ca 600 degrees C.
 
"Here is an interview (Part 2/3) with Niels Harrit from July 2009 which I had not seen before, making a statement about active and dead chips:
http://www.youtube.com/watch?v=9yrMIhVq-G0

And he goes on to speculate that perhaps exposure to water is one way to deactivate chips.

A bit further in the interview, he talks about how NIST has heated steel columns and found that the Tnemec primer was "stable". Which kind of raises the question: Why did it not occur to Harrit that perhaps some of the "dead" chips could be Tnemec primer?


And this raises the questions:...
"

Why the obsession with minutiae?

As Dr. Harrit himself said in a link you provided recently;

"...since you cannot put every basic control test image or report every bit of supporting data in a journal article. The articles would be so enormous that no one would bother reading them and no journal would possibly care to print them. There are some things that are implied."

Laypeople who are unversed in all the routine data-collecting that makes up laboratory research procedures, might mistakenly believe that a final report 'is the iceberg' and not the 'tip of the iceberg'.

MM
 
Last edited:
Why the obsession with minutiae?

As Dr. Harrit himself said in a link you provided recently;

"...since you cannot put every basic control test image or report every bit of supporting data in a journal article. The articles would be so enormous that no one would bother reading them and no journal would possibly care to print them. There are some things that are implied."

Laypeople who are unversed in all the routine data-collecting that makes up laboratory research procedures, might mistakenly believe that a final report 'is the iceberg' and not the 'tip of the iceberg'.

MM
Then maybe they should have stuck to the things that mattered. Did they not figure that out until later? :rolleyes:

BTW: No one is really reading it anyway. ;)
 
MM:
Your post is proof that the paper is no good. One aspect of a good paper is the results are repeatable by anyone reading it. It can't be done because the paper does not contain the information to do it. They don't even specify what chips a "thermetic" and which one are not.

It doesn't get any simpler than that.
 
"...There are some things that are implied." ...
Then can you please spell out the answers to the following questions, as far as they are implied in the paper:
  • Did they study dead chips?
  • Are they different, by morphology or elemental spectrum, from active chips?
  • If yes: by what criteria can the dead chips be distinguished from the active chips? Did they apply these criteria before doing further studies on chips a-d, the MEK-chip, the multilayered chip or the chip whose resistivity is 10 ohm-m?
  • If not: How did they make sure that the chips a-d, the MK-soaked chip, the multilayered chip or the chip whose resistivity is 10 ohm-m were active? Did they ignite them afterward?
Or, alternatively, point out which answers are not implied by the paper.

Thanks.

(MM, that's 4 question, requiring 4 specific replies; each replyis either "this is not implied - ask Dr. Harrit" or "this is implied, and the answer is...".

Prediction: MM will not deliver even one reply in that form, when four replies are required)
 
Here is another paper with some insight on how epoxy with nanoparticles performs when heated:

Camino G, Tartaglione G, Frache A, Manferti C, Costa G: Thermal and combustion behaviour of layered silicate-epoxy nanocomposites. Polymer Degradation and Stability 90 (2005) 354-362
http://144.206.159.178/ft/864/569194/12251709.pdf

The interesting bit is the detailed description of how pure epoxy degrades, chars and oxidizes under nitrogen and under air at temperatures increasing from room temperature to above 700 °C, in Section 3.2.1
(Note that the TGA-curves in Fig. 4. do NOT coincide with positive energy release; they indicate mass loss from decomposition (endotherm) as well as mass loss from oxidation of solids (exotherm), which both yield gaseous products).
 
Just to revive this thread a little bit...

Truther Ziggi Zugam aka Siggi published now a new article on Debunking the Debunkers, called "The Energetic Red Layer: The FTIR".

Ziggi wrote (among others):
"The best known example of a skeletal matrix is based on a fluorinated polymer, but the "debunker" known as Oystein states that it "is safe to assume that this [red layer]matrix is some form of organic polymer (or a mix of polymers), that contains no Fluorine or Chlorine," and his friend Kminek agrees, "since no fluorine was detected." The fallacy of their assumption becomes apparent when you realize that Harrit explained a long time ago that "one problem with the investigation which has just been done is that we cannot see fluorine because the response from fluorine lies under the iron response, which we see all the time."

Harrit was basically right in a sense that fluorine and iron XEDS signals below 1 KeV lie at very similar positions about 0.7 KeV.
But, if (hypothetically) the polymer binder in the red layers is fluorinated polymer, like Viton in known "superthermite", fluorine signal should be very high/much higher than Fe signal. Common fluorinated polymers have more of fluorine than of carbon in them. E.g., in Teflon (PTFE), the molar ratio F/C is 2:1, in Viton, this ratio is also much higher than 1. Wiki says "The fluorine content of the most common Viton grades varies between 66 and 70%."

Therefore, XEDS should clearly detect such fluorinated polymers (their fluorine peaks) in the red layers of red/gray chips.
After some googling, I have been able to find only this XEDS spectrum of Teflon:

picture.php


(Do not look at Au peaks, they are not relevant for "our case")
Here, fluorine peak is even much higher than carbon peak (for reasons unknown to me). Anyway, this spectrum seems to indirectly indicate that if the polymer in Bentham chips (a) to (d) is fluorinated, this should be accompanied by very distinct fluorine peak in XEDS spectra, no matter that signal of this element lies at the similar position as the small iron peak:cool:

(I'm aware that fluorine with its atomic number 9 is a pretty light element and its detection by XEDS may be problematic. This was just my remark and better analysis of people knowing XEDS in more detail is welcome...)
 
Last edited:
Ivan,

yeah I saw Ziggi's article, and it is full of flaws. He makes a few observations here, some suppositions there, throws in half-understood half-truths, and basically it is a divergent mess.

Yes, Fluor would show very prominently at 20 keV even in low concentrations and would not hide under the Fe L-alpha peak if there is 2 wt-% or more F in the mix.

At a molar ratio of F:C of 2:1, the F-peak will come out many many times larger than the C-peak - something like 20 times higher.
At F:C of 3:5, which is close to 1:1 by weight, the F-peak is 4x as high as the C-peak. Don't know why, that's just how it actually is.

All those fluorinated polymers have low specific energies and don't help to solve the problem with the 7.5 kJ/g release they measured for one chip.

Harrit's statement about fluor hidung under the Fe-signal just goes to show that Harrit is an amateur when it comes to reading XEDS graphs. I am sure Farrer would have cringed if he ever heard Harrit say such a thing.

I was going to mention that, thanks. Every time a Harritite squeezes another supposition out of #2, a rumble is heard from the tomb of William of Ockham.
 
Kminek: I'm aware that fluorine with its atomic number 9 is a pretty light element and its detection by XEDS may be problematic.

How about FTIR?

I asked Oystein before:
For the record, I really do wonder if you would really accept Harrit´s FTIR if it is consistent with superthermite...?

and Oystein gave the answer:
Yes, absolutely.

But he reads the following in an article, without mentioning it:

one member of the team has provided a little teaser; the snapshot of his FTIR spectra in this video(at 9m.25s) demonstrates that their result is consistent with the fluorine-infused superthermite in the Gash report.
 

It does not match. That is funny, 911 truth is so darn gullible. Part of 911 truth spread lies and fantasy, the other part is the so darn gullible part. The video was funny, but why did it and the paper fail to earn a Pulitzer? lol

If you are sure, take this "evidence", team with a new paper, and apply for that Pulitzer, and show us all how it is done. Too bad you are stuck with nonsense and crazy 911 truth claims based on nothing.

Seriously, Jones made up his claim out of thin air by looking at some sparks spraying from a section of the WTC; no damage was found to any steel due to thermite, but Jones was upset politically, and made it up. He fools people who can't do science.

You can't be funnier if you tried. Most 911 truth followers figure out the fraud of Jones and leave, smarter for the experience.
 

I actually did refute that FTIR "teaser", two posts above yours:
http://www.internationalskeptics.com/forums/showpost.php?p=9075979&postcount=1651
The "teaser" pretends that the FTIR for the organic matrix is consistent with a particular experimental preparation by Gash et al. in 2002. Imn particular, with Viton-A.

Viton A is ca. 66% F by mass, less than 34% by mass C.

If this stuff was really in the red layer of the chips, there would be a HUGE peak for fluor in all of the XEDS-spectra, it would be many many many many many many many many many times larger than the C-peak, which is generally the highest in the spectra they show. And all the other peaks, including iron, would seem totally insignificant next to it.

I plan to write a response to Ziggi in my blog, but didn't have the time until today. Will perhaps take a few more days.


Bottom line: That FTIR-teaser, in isolation, proves nothing; it isn't published, it is void of useful context, and it is refuted by ALL of the other evidence we have. This is cherry-picked data, hence the sort of stuff that truthers love to believe if their gurus say so.


Would you join me in asking Kevin Ryan to release the full FTIR data?
 
The fluorine idea is total nonsense. Anyone going down that route has no idea what they are talking about. Fluorine would show up on the EDX any way. This Ziggi person is talking rubbish. Having looked at the video and taken a screen shot it's obvious that the person who made that composite graph has absolutely no idea what they are doing with regard to FTIR.

Overlaying one graph on top of the other is stupid because you are not looking for troughs and peaks to match perfectly. What you are looking for is specific types of troughs (Intensity - weak, medium, strong and shape- broad, sharp) at specific wavenumbers which correspond to certain bonds and functional groups of bonds.

The FTIR library (which normally comes with the equipment) allows a computer program to match the unknown spectra to known materials anyway. There is no need to go superimposing random spectra over the top. To see how a professional does it then see Dr Millette's report.

Here's a screenshot.

picture.php
I checked the link and it also looks like the above Gash formulation FTIR doesn't contain Al. They mention two formulations one FeO/Viton and another FeO/Al/Viton - this FTIR not shown.

https://e-reports-ext.llnl.gov/pdf/244137.pdf
 
Last edited:
The fluorine idea is total nonsense. Anyone going down that route has no idea what they are talking about. Fluorine would show up on the EDX any way. This Ziggi person is talking rubbish. ...

It is true - the fluorine (F) peak is pretty much at the same location as the L-alpha peak for iron (Fe), and so it's not implausible that one could masl the other.

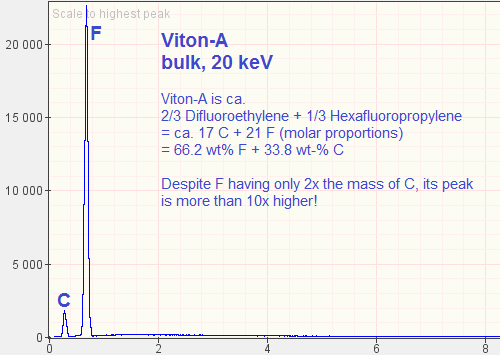
However, F tends to respond very strongly to 20 keV. So if the idea that Ryan/Ziggi/jtl want to inject here is that somehow some of the red-gray chips contain Viton-A, like Gash's experimental formulation, then F would very much dominate C, as you'll soon see.

Viton-A is a co-polymer of Difluoroethylene (shorthand: VF2; sum formula: C2H2F2) and Hexafluoropropylene (HFP; sum formula: C3F6).
Wikipedia says that Viton-A has a fluorine content of 66%, and I found that a mix of 2/3 VF2 and 1/3 HFP gives you 66.2% F by weight.

To give people an idea for how well fluorine shows on EDS-graphs, I ran a few simulations.

The first is Viton-A alone:

Viton-A_bulk_20keV_zpse2e44753.png


Huge F, small C. This will of course show in any mix!


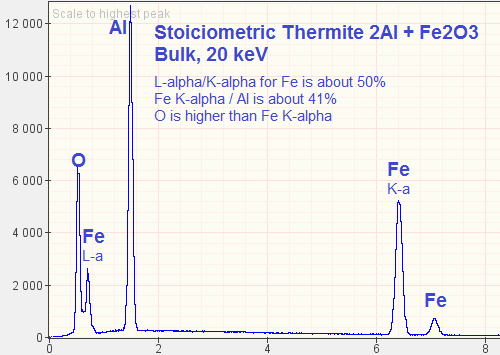
Then, for reference, stoichiometric thermite (2 Al + Fe2O3) alone:

Thermite_bulk_20keV_zps6bf6905b.png


Notice how Fe has three peaks, of which the first and second are of interest here: In my simulation, the first peak (L-alpha) comes out ca. 50% of the height of the main peak, K-alpha.
Al is 25.3% of the mass here, and Fe 52.25%, but the Al-peak is by far the highest.

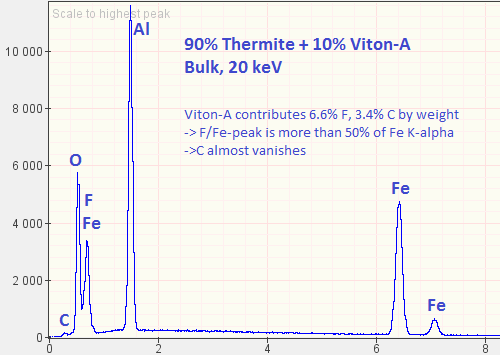
Now let us mix 90% thermite and 10% Viton-A! I choose this ratio because it's what Tillotson and Gash did in the paper with the DSC test. In that mix, we'll find 47% iron and 6.6% fluorine, and this is what the EDS comes out as:

90Thermite10Viton_bulk_20keV_zps59eb3cd1.png


We now have, to the right of O at ca. 0.7 keV, a peak jointly for F and Fe (L-alpha). This peak is now a good 70% of the height of Fe K-alpha - and this ratio you never really get to see for Fe alone. So even though you can't see F separately, you should already know it's there, because that 0.7 keV peak is too high relative to the 6.4 keV peak of Fe K-alpha.
But there is practically no C in that spectrum! So Viton-A cannot be the matrix here! And we need a higher C-peak than all of the metals! This cannot be done by adding more Viton-A, this can only be done by adding a fluorine-free organic polymer.


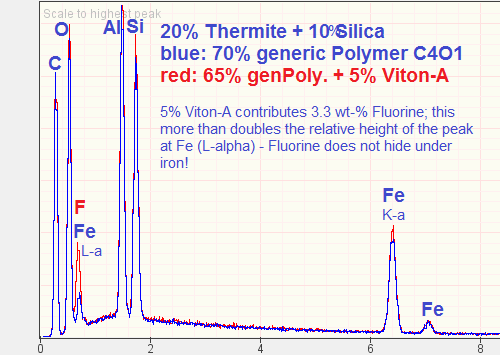
Let's jump ahead. I am now comparing two mixes:
In both, I have 20% stoichiometric thermite + 10% silica (let's not forget there is always as much Si as Al, or more!); but in the first simulation (blue graph) I filled this up with 70% of some generic organic polymer with a molar C:O ratio of 4:1 (epoxy could be an example of this), while in the red graph, I have 65% generic organic polymer + 5% Viton-A. Both contain 10.45 wt-% iron. The blue mix has 56% carbon, the red mix has 53.7% carbon and 3.3% fluorine.

20Thermite10Silica_comparewith-without-Viton_bulk_20keV_zps628a1c99.png


As you can see: The peak at 0.7 keV is really dominated by fluorine, not by iron! No competent analyst would miss the presence of F here! (And I am sure that the software wouldn't miss it either).


You'd need a lot less than 5% Viton-A to make the fluorine disappear. But then, all the properties that might make a fluorinated polymer attractive for use in such a "superthermite" get diluted to a point where it is useless.

And again, we find that the mass of the chip, and hence its energy content, is far and away dominated by some ordinary, non-fluorinated, non-halogenic organic polymer!


Of course truthers like Ziggi, jtl or Senemut would never figure these things out by themselves. They put all their faith in their gurus like Ryan and Harrit. Critical thinking? Scepticism? Zero.
 
It is true - the fluorine (F) peak is pretty much at the same location as the L-alpha peak for iron (Fe), and so it's not implausible that one could masl the other.

However, F tends to respond very strongly to 20 keV. So if the idea that Ryan/Ziggi/jtl want to inject here is that somehow some of the red-gray chips contain Viton-A, like Gash's experimental formulation, then F would very much dominate C, as you'll soon see.

Viton-A is a co-polymer of Difluoroethylene (shorthand: VF2; sum formula: C2H2F2) and Hexafluoropropylene (HFP; sum formula: C3F6).
Wikipedia says that Viton-A has a fluorine content of 66%, and I found that a mix of 2/3 VF2 and 1/3 HFP gives you 66.2% F by weight.

To give people an idea for how well fluorine shows on EDS-graphs, I ran a few simulations.

The first is Viton-A alone:

[qimg]http://i1088.photobucket.com/albums/i328/MikeAlfaromeo/ActiveThermiticMaterial/XEDS-Sims/Viton-A_bulk_20keV_zpse2e44753.png[/qimg]

Huge F, small C. This will of course show in any mix!


Then, for reference, stoichiometric thermite (2 Al + Fe2O3) alone:

[qimg]http://i1088.photobucket.com/albums/i328/MikeAlfaromeo/ActiveThermiticMaterial/XEDS-Sims/Thermite_bulk_20keV_zps6bf6905b.png[/qimg]

Notice how Fe has three peaks, of which the first and second are of interest here: In my simulation, the first peak (L-alpha) comes out ca. 50% of the height of the main peak, K-alpha.
Al is 25.3% of the mass here, and Fe 52.25%, but the Al-peak is by far the highest.

Now let us mix 90% thermite and 10% Viton-A! I choose this ratio because it's what Tillotson and Gash did in the paper with the DSC test. In that mix, we'll find 47% iron and 6.6% fluorine, and this is what the EDS comes out as:

[qimg]http://i1088.photobucket.com/albums/i328/MikeAlfaromeo/ActiveThermiticMaterial/XEDS-Sims/90Thermite10Viton_bulk_20keV_zps59eb3cd1.png[/qimg]

We now have, to the right of O at ca. 0.7 keV, a peak jointly for F and Fe (L-alpha). This peak is now a good 70% of the height of Fe K-alpha - and this ratio you never really get to see for Fe alone. So even though you can't see F separately, you should already know it's there, because that 0.7 keV peak is too high relative to the 6.4 keV peak of Fe K-alpha.
But there is practically no C in that spectrum! So Viton-A cannot be the matrix here! And we need a higher C-peak than all of the metals! This cannot be done by adding more Viton-A, this can only be done by adding a fluorine-free organic polymer.


Let's jump ahead. I am now comparing two mixes:
In both, I have 20% stoichiometric thermite + 10% silica (let's not forget there is always as much Si as Al, or more!); but in the first simulation (blue graph) I filled this up with 70% of some generic organic polymer with a molar C:O ratio of 4:1 (epoxy could be an example of this), while in the red graph, I have 65% generic organic polymer + 5% Viton-A. Both contain 10.45 wt-% iron. The blue mix has 56% carbon, the red mix has 53.7% carbon and 3.3% fluorine.

[qimg]http://i1088.photobucket.com/albums/i328/MikeAlfaromeo/ActiveThermiticMaterial/XEDS-Sims/20Thermite10Silica_comparewith-without-Viton_bulk_20keV_zps628a1c99.png[/qimg]

As you can see: The peak at 0.7 keV is really dominated by fluorine, not by iron! No competent analyst would miss the presence of F here! (And I am sure that the software wouldn't miss it either).


You'd need a lot less than 5% Viton-A to make the fluorine disappear. But then, all the properties that might make a fluorinated polymer attractive for use in such a "superthermite" get diluted to a point where it is useless.

And again, we find that the mass of the chip, and hence its energy content, is far and away dominated by some ordinary, non-fluorinated, non-halogenic organic polymer!


Of course truthers like Ziggi, jtl or Senemut would never figure these things out by themselves. They put all their faith in their gurus like Ryan and Harrit. Critical thinking? Scepticism? Zero.


Dear Mr. Oystein,

“Curiouser and curiouser, Alice in Wonderland

If you don’t know the specific working conditions for the EDX, and how it was applied, you are really out on a limb as it where. They must have been using either a “Thin window, or “Windowless detector.
In general the smaller the specimen size, below 10 micro meters, ish, less Kv is required to avoid electrons getting out of the specimen, i.e. we want them to thrash about and produce X-rays, and not transit the material without any interactions. The surface topography is also causing problems, where a flap of material might have to be traversed before penetration the specimen proper for example. We just do not know!

Kminek: I'm aware that fluorine with its atomic number 9 is a pretty light element and its detection by XEDS may be problematic.
Not really, just depends what sort of EDX you are using, and the amount of current, not Kv, you can deliver onto the specimen for a given beam diameter, i.e. a tradeoff between the best possible resolution, and maximum count rate. This is the important factor at low Kv. We know the FEG SEM they used was hopeless at delivering significant amounts of current, and there are no published figures. So……………
Concerning the Flourine, I found this.

Fluorine resolution FKFWHM
The width of the peaks in a spectrum will
vary depending on the energy of the X-ray
line. In Fig. 8 this variation with energy has
been calculated to show how the resolution
should change with X-ray energy for Si(Li)
and HpGe detectors with different Mn
resolution specifications.

PM Note, the different types of semiconductor.for Si(Li) and HpGe

http://www.google.se/url?sa=t&rct=j...HFcNReTK1eL4Hiy9VAslAn2tWBnA&sig2=mj9PQh4R6y-


It is very important to understand the advantages of real WDX Spectrometer.
 
Last edited:
Dear Mr. Oystein,

“Curiouser and curiouser, Alice in Wonderland

If you don’t know the specific working conditions for the EDX, and how it was applied, you are really out on a limb as it where. They must have been using either a “Thin window, or “Windowless detector.
In general the smaller the specimen size, below 10 micro meters, ish, less Kv is required to avoid electrons getting out of the specimen, i.e. we want them to thrash about and produce X-rays, and not transit the material without any interactions. The surface topography is also causing problems, where a flap of material might have to be traversed before penetration the specimen proper for example. We just do not know!
...

Peter,

we actually do know that they are using a “Thin window, or “Windowless detector - an ultrathin window detector, according to this product description of the equipment they used (FEI XL30-SFEG):

http://www.kstreetstudio.com/science/experiments/files/FEI-XL30-SFEG.pdf

We know this is so because they have no trouble picking up C.

We also know a bit about the specimens: For Fig. 7, they cut chips that had red layers pf 15-30 µm thickness and tested the freshly exposed surface, which seemed quite plan, judging from Fig. 5. The depth of the layer was considerably larger than that - many tens of µm, if not hundreds. So we know the specimens are not below 10 µm.

And anyway, with my examples I am merely illustrating how the presence of even a little bit (3%) of F increases the count around 0.7 keV so much that an experienced operator could hardly miss it. If the hypothesis is that the matrix consists to a significant percentage of such a fully fluorinated polymer, AND they measure a lot of C (they do), then they MUST also measure a lot of F. Doesn't really matter if my peak heights are off by a factor of 2 here or there.
 

ISF - Join now!

Every member here is approved by hand. No bots, no spam, just people who care about evidence and honest debate.

Membership is free!

Create your free account

Back
Top Bottom