Merged Thread to Discuss The Excellent Analysis of Jones latest paper

Just to reiterate.

If they had separated out magnetically attracted, red/gray PAINT chips out of the initial isolated pile of red/gray chips, why did they use EXTERNAL REFERENCES and EXTERNAL "OTHER" PAINT to compare the thermitic red/gray chips to?

According to you and Harrit's group, they had the paint chips right there in front of them!!

:boggled:

Um, because they are agenda-driven pseudoscientists of the worst kind? :rolleyes: (Not to mention, incompetent!)
 
I do not see what connection you are trying to make?

A Resistivity reading would not subject the sample to a high voltage electron beam.

A 9V battery in a Multimeter should suffice.

Because of its 10 ohm-m resistivity, I do not believe anyone would recommend the red-layer material for wiring their house.

But even a 5-year old could quickly learn how to select low resistance chips. Well maybe not. But certainly any young adult.

What makes it easy is the huge gap between 10 and 1010 ohm-m. Fortunately, 10 ohms is an easy reading to obtain compared to useful readings below 0.

On the old Simpson Multimeters on the 105 Ohm Scale, the meter would be swinging from one end to the other measuring 10 ohm vs 1010 ohm resistances.

The resistivity of the gray-layer is irrelevant if it is the resistivity of the red-layer which is being tested.

The Bentham Paper said the chips were discernible by eye and range up to 3mm.

As long as one of the probes is electrically contacting the red-layer surface, and assuming the other probe is also electrically contacting the red-layer or the gray-layer, a useful reading should be obtainable. Red to red is best as it eliminates the possible addition of resistance from the gray layer.

MM

If the resistance is 10 ohm per meter then a chip a mm long would have a resistance of .01 ohm. I doubt if your old Simpson meter or the Fluke they used could measure .01 ohm.
 
Thanks, Oystein, You've just shown nicely what is possible to dig out from the available data, a very good piece of detective work:o) And although there are necessarily some uncertain inputs, your claim that MEK chip corresponds to Tnemec paint contaminated with 11 % of gypsum sounds very reasonably:cool:

These findings can serve as some indirect proofs only for us, debunkers, but they might perhaps influence even some smarter truthers like ScootleRoyale, who was able to admit that chips (a) to (d) are Laclede paint (?)

Anyway, we have here two hypotheses:
1) MEK chip is Tnemec red primer on rust scale, contaminated with ca 10 % of gypsum
2) MEK chip is super-duper nanothermite, with ca 1 % of aluminium, some Zn and other non-thermitic elements, which has, just by chance, the composition of the Tnemec primer employed massively for the painting of WTC perimeter columns.


I very strongly support the first hypothesis:cool:
 
Last edited:
Finally, I tried to match my Tnemec-Formula, plus gypsum and potassium, with Fig 14:
...

Yayyy, I just made another nice find: From the Jones presentation in Australis in December 2009 comes this screenshot:

JonesPrimerPaint-4m24s_zps5bc2ec06.jpg


http://www.youtube.com/watch?v=ScY8c9THrTY#!?t=4m23s
Notice it is from the surface of an uncleaned chip.
It has the familier signature of our LaClede paint (Al=Si and Fe dominate; bit of Cr), but it also has a mid-size Ca-peak and smaller peaks for S and K. And a tiny bit of Ti.

Could it be this uncleaned LaClede-chip has similar gypsum plus potassium contamination as the Tnemec-chips? Yes, it could! That would corroborate that some S, K and Ca are commonly found as contamination on the surface of all chips - and further strengthen my case for the Tnemec formulation and the contention that the MEK-chip was Tnemec!
 
Last edited:
Yayyy, I just made another nice find: From the Jones presentation in Australis in December 2009 comes this screenshot:

[qimg]http://i1088.photobucket.com/albums/i328/MikeAlfaromeo/ActiveThermiticMaterial/StevenJonesPresentation1/JonesPrimerPaint-4m24s_zps5bc2ec06.jpg[/qimg]

http://www.youtube.com/watch?v=ScY8c9THrTY#!?t=4m23s
Notice it is from the surface of an uncleaned chip.
It has the familier signature of our LaClede paint (Al=Si and Fe dominate; bit of Cr), but it also has a mid-size Ca-peak and smaller peaks for S and K. And a tiny bit of Ti.

Could it be this uncleaned LaClede-chip has similar gypsum plus potassium contamination as the Tnemec-chips? Yes, it could! That would corroborate that some S, K and Ca are commonly found as contamination on the surface of all chips - and further strengthen my case for the Tnemec formulation and the contention that the MEK-chip was Tnemec!
Note how Jones bangs on about Millette finding Titanium (dioxide) in his chips and therefore Millette's chips can't be the same as those in the Harrit et al paper, yet the hypocrite is more than happy to stand in front of an EDX spectrum of Basile's chips that clearly show Titanium is present.

Truther chip containing Ti = thermite
Non-truther chip containing Ti = not the same as truther chip!

It's hilarious how these truthers can claim that their chips are thermite when they have Cr, Ti, Pb and other "impurities" (elements not contributing to the reaction) in them. They never explain why there is so much impurity nor why there is a great discrepancy between impurities or why there's next to no aluminium in the chips anyway. It's pathetic.

If you were making a super-duper-nano-thermite in a lab or even industrially you'd have far better quality control than the examination of the material suggests.
 
Interesting finding, Oystein:cool:

Whereas Ca and S should originate from gypsum, K can originate from pulverized concrete (cement in it), which can contain e.g. potassium silicates. Perhaps some XEDS of cement/concrete from WTC catastrophe is available somewhere?

This XEDS spectrum really looks like contaminated Laclede (:cool:), except O and C peaks, which are quite a little ones, in comparison with XEDS of Bentham chips (a) to (d). Perhaps owing to used device/settings?

Your presumption that all red/gray chips should be contaminated with basically same stuffs and to the basically similar extent sounds reasonable.
 
Interesting finding, Oystein:cool:

Whereas Ca and S should originate from gypsum, K can originate from pulverized concrete (cement in it), which can contain e.g. potassium silicates. Perhaps some XEDS of cement/concrete from WTC catastrophe is available somewhere?
...

Small particles like paint chips can only be contaminated with particles that are even much smaller. Otherwise, the contamination would be rather obvious under a microscope, and might be easily removed.

I am too lazy to support the following with references, but I hope this intuitively plausible:
Gypsum can be, and is, crushed to much smaller particle sizes than (most components of) concrete. That's why I would not expect to find, for example, silica particles from concrete on chips. Not so sure about silicates. Potassium silicate should not be a major constituent - would that be in the aggregate? There is always more Ca-compounds in concrete, oxide mainly, to some extent as aluminate or silicate. I could not distinguish those from the same compounds that I presume to be in the Tnemec pigment. But if we indeed have close to 2% K-compounds from concrete, how much more Ca-compounds should we expect then, too?

I have recently read that gypsum has been descibed as the major phase in the very fine particulate, along with mineral fibers. Would have to dig into the RJ Lee Report and others to find details.
 
Small particles like paint chips can only be contaminated with particles that are even much smaller. Otherwise, the contamination would be rather obvious under a microscope, and might be easily removed.

I am too lazy to support the following with references, but I hope this intuitively plausible:
Gypsum can be, and is, crushed to much smaller particle sizes than (most components of) concrete. That's why I would not expect to find, for example, silica particles from concrete on chips. Not so sure about silicates. Potassium silicate should not be a major constituent - would that be in the aggregate? There is always more Ca-compounds in concrete, oxide mainly, to some extent as aluminate or silicate. I could not distinguish those from the same compounds that I presume to be in the Tnemec pigment. But if we indeed have close to 2% K-compounds from concrete, how much more Ca-compounds should we expect then, too?

I have recently read that gypsum has been descibed as the major phase in the very fine particulate, along with mineral fibers. Would have to dig into the RJ Lee Report and others to find details.

It is clear that the gypsum should be the main source of superfine dust, which we find also as contaminant of chips.
As for concrete, here is one XEDS of some WTC concrete:

picture.php


In this spectrum, potassium peak is visible/remarkable, whereas in other spectra of "concrete phase", there is just a very little "blimp" (or no K peak at all). Hence, cement/concrete should not be the source of K in Jones' spectrum above.

(Note: According to this table, potassium is present in substantial quantities in biotite, muscovite, "feldspar", illite and other minerals present in WTC...)
 
Last edited:
This Tnemec formulation contains 0.8-0.9% by weight Al. Fig 14 is a close enough match with my simulated Tnemec, with little contamination, that we can conclude that this chip really contains not significantly more than 1% Al, and most likely <1%. With this little Al, it's preposterous to think it might be "thermitic"
Can it be inferred then that the Al in fig. 15 is not in the chip?
 
Can it be inferred then that the Al in fig. 15 is not in the chip?

No, or not for all Al in that map.

Anywhere you look, there is going to be less than, say, 30% Si. So the Si-map would be black, if the threshold value to flick on a pixel were 30% Si.

So the threshold values must be significantly lower than that, and perhaps this is a matter of custom setting. If they set the threshold for Al to 0.1%, then they'll see Al everywhere, and if they set it to 5%, they'll see it almost nowhere.

There is more than 0% Al in the chip - and it is probably well distributed. So you can always get a map with seemingly plenty of Al.


What gets me is that there is a lot of Al-signal outside of the chip, and so much on the left lower edge. I remain convinced that somehow this is catching signal from the sample holder - an aluminium plate!
 
"Yayyy, I just made another nice find...

Could it be this uncleaned LaClede-chip...

This is a good example of lying.

With nothing more than wishful thinking, you've stated as fact that Dr. Jones is displaying spectra for a LaClede paint chip.

MM
 
Originally Posted by Ivan Kminek
Interesting finding, Oystein

Whereas Ca and S should originate from gypsum, K can originate from pulverized concrete (cement in it), which can contain e.g. potassium silicates. Perhaps some XEDS of cement/concrete from WTC catastrophe is available somewhere?

Small particles like paint chips can only be contaminated with particles that are even much smaller. Otherwise, the contamination would be rather obvious under a microscope, and might be easily removed.

I am too lazy to support the following with references, but I hope this intuitively plausible:
Gypsum can be, and is, crushed to much smaller particle sizes than (most components of) concrete. That's why I would not expect to find, for example, silica particles from concrete on chips. Not so sure about silicates. Potassium silicate should not be a major constituent - would that be in the aggregate? There is always more Ca-compounds in concrete, oxide mainly, to some extent as aluminate or silicate. I could not distinguish those from the same compounds that I presume to be in the Tnemec pigment. But if we indeed have close to 2% K-compounds from concrete, how much more Ca-compounds should we expect then, too?

I have recently read that gypsum has been descibed as the major phase in the very fine particulate, along with mineral fibers. Would have to dig into the RJ Lee Report and others to find details.

In my long career in industrial chemistry, I found that bulk industrial-grade minerals contain traces of all sorts of other minerals. There's no reason to remove them if they do not interfere with the desired use of the product.

For example, sodium salts extracted from the brines of Searles Lake, California typically contain traces of rubidium. Rubidium has enough economic value to justify recovering some of it from the brines, but not enough to justify removing all of it by repeated recrystallizations.

Analogously, it is entirely reasonable to expect to see traces of potassium aluminum silicate or magnesium silicate in bulk industrial grade kaolin (aluminum silicate). I would also not be surprised to find primers other than Laclede or Tnemec. Contracts typically specify such-and-such paint or equivalent. Nobody is going to hold up delivery if they don't have the exact primer specified, as long as they have something just as good. You might find primer from Pittsburgh Paint, Sherwin-Williams, Rust-Oleum, or dozens of other manufacturers.
 
This is a good example of lying.

With nothing more than wishful thinking, you've stated as fact that Dr. Jones is displaying spectra for a LaClede paint chip.

MM

Oh, is it? :D

Let's see, MM, if you can answer a few questions that help us to discern whether my hypothesis is well supported or not:

1. Do you accept as TRUE that LaClede Steel Company painted the WTC floor trusses with a primer paint that has the formulation:
Epoxy: 71.5 % | Iron oxide: 15.7% | Al-silicate: 11.7% | Strontium chromate: 1.1% (balance: rounding error)

2. Do you accept as TRUE that, as Kevin Ryan, Frank Legge and Mark Basile have stated, you find red WTC primer in the WTC dust?

3. Do you accept as TRUE that is is therefore POSSIBLE that some of those chips could be LaClede primer?

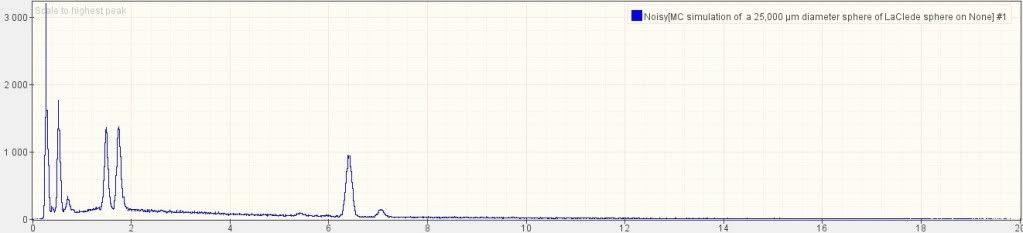
4. Do you accept as TRUE that an XEDS spectrum of this LaClede primer at 20 keV would look like this:
LaClede_Sphere25micron_01.jpg


5. Do you accept as TRUE that bright red iron oxide pigments are typically 100-200 nm in size and rhombic in shape?

6. Do you accept as true that Kaolin clay typically looks like this:
PruettWebbFig06.jpg


7. Do you accept as TRUE that Kaolinite is an Aluminium Silicate with the sum formula Al2Si2O5(OH)4 - so there are equal amounts of Si and Al in it?

8. Do you accept as TRUE that the EDS spectra of the red layers of chips a-d, shown in Fig 7, look VERY much like the simulated LaClede spectrum above?

9. Do you accept as TRUE that the iron oxide grains shown in chips a-d, for example in Fig. 8, have the shape and size of bright red iron oxide PIGMENTS?

10. Do you accept as TRUE that the plates found in chips a-d have the same shape and are of the same order of magnitude as typical plates of kaolin clay?

11. Do you accept as TRUE that Fig 10 shows that, in chip a, Al and Si have basically an identical distribution, and are located where there are plates in the corresponding BSE image?

12. Do you accept as TRUE that Fig. 11a shows proof that Al and Si are found in practically equal amounts in those plates?

13. Do you thus accept as TRUE that these plates contain Al and Si in equal amounts, just like Kaolin does?

14. Do you accept as TRUE that Fig 6, the EDS spectra of the gray layers of chips a-d, essentially shows the signature of oxidized iron, with small amounts of carbon an manganese?

15. Do you accept as TRUE that the steel that LaClede used for the floor joists was an alloy with manganese and low carbon?

16. Do you thus accept as TRUE that the elemental signature of the gray layers of chips a-d is consistent with the floor truss steel?

17. Do you accept as TRUE that the elemental signature of the gray layers of chips a-d is consistent with the paint LaClede used on the floor trusses?


17 questions, MM. I fully expect you to dodge all 17 of them, but we all know that you read them, and we all know why you won't answer them.


And I will LOL. Runn, MM, run! :D

 
Last edited:
You're right, it is a good example of lying... on your side. Oystein has provided much more than wishful thinking.

As you folks have repeated many times here, a hypothesis is not a fact and is not a theory.

To boldly assert that it is, as Oystein continues to do, is not only violating scientific principles, but is outright lying.

MM
 
As you folks have repeated many times here, a hypothesis is not a fact and is not a theory.

To boldly assert that it is, as Oystein continues to do, is not only violating scientific principles, but is outright lying.

MM

I think Niels Harrit would correct you on that stance. Here is what he calls his paper, and what his take is on the nature of "hypothesis" in terms of scientific principles:
Niels Harrit said:
A scientific paper is a set of data, a discussion and a best hypothesis. And that's it. And the best hypothesis stands until you come out with a better hypothesis.
Source: Harrit at Toronto Hearings, at 1:06:15

So Harrit considers his "nano-thermite" conclusion to be a "hypothesis". He sure sells it as fact, don't you think?


Also: I noted that you dodged all 17 question, MM! I see you ruuuuunning away! I am laughing my butt off here! :D :D
 
Last edited:
Hey folks,

I just had a close look at the dissertation of Louis Ferranti, Jr. titled "Mechanochemical Reactions and Strengthening in Epoxy-Cast Aluminum Iron-Oxide Mixtures"
https://smartech.gatech.edu/handle/1853/19722

I believe Ivan found this a long time ago, but I don't recall how much meat we had fleshed out of it then (probably early June 2012; too lazy to check).

I found wonderful graphs and descriptions that may help explain two of the four DSC traces in Harrit et al.:

ActiveThermiticMaterial_Fig19.jpg


Notice how the blue and red line both have a small peak just under 400 °C, followed by a relative trough around 410 °C. Then, both take off towards their peaks (well, the blue line has another mini-trough at 420 °C).

Now let's read Ferranti, page 192 onward, where he discusses DTA trace of pure epoxy, and epoxy mixed with various vol-percentages of Al+Fe2O3 in nano- and micro-size:

Ferranti said:
Each composition shows an initial exothermic peak at 383.1 +/- 6.1 °C due to crystallization. This is known as cold crystallization and occurs upon heating polymers that are amorphous or have very low crystallinity [171]. ... The crystallization peaks were followed immediately by an endoderm that ranged between 397 and 410 °C, corresponding to the decomposition of epoxy. Pure epoxy has a decomposition temperature of 410.2 +/- 0.7 °C, which is in fairly good agreement with many studies conducted for epoxy resin cured with numerous hardeners [172-174]. The thermal stability in cured-epoxy resin systems will depend, in part, on the chemical structure and bonds, as well as on the functionality and crosslinking density of the resin [171]. The volatile products evolving from the decomposition of epoxy typically include water, carbon dioxide, and carbon monoxide [172]
He discusses how the mixing of epoxy with stuff seems to shift the handbook values somewhat, and also that they depend on the specifics of the epoxy.

But hey, how nice: Epoxy crystalizes exothermally just where the two lines above peak, and decomposes endothermally just where the lines have an endotherm signal! And he confirms that epoxy releases CO upon decomposition - CO which, as we know, can reduce iron oxide!


A few pages earlier, he goes into some detail on how Fe2O3 goes exotherm with increasing power early on as it reduces on its own to Fe3O4.

Ferranti doesn't have the same peaks as Harrit et al. because he does these experiments, competent as he is, under inert gas (argon).


I think this is a nice corroboration of our hypothesis that some chips are laClede paint with a homogeneous epoxy matrix (blue and red curve). The green and black curves on the other hand probably have a more heterogeneous organic binder with no clear temperature limits for crystallization, decomposition or combustion.


Also, Ferranti typically observes a clear, sharp endotherm at oder slightly under 660 °C for the melting of Al, even when his nano-Al starts oxidizng at a lower temperature. Now get this: Te green line, after returning to almst zero near 540 °C, has a slight endotherm trough at - 660 °C :D. And the black line slightly below that (minimum at ca. 645 °C). A bit of elemental Al after all? :p
 

ISF - Join now!

Every member here is approved by hand. No bots, no spam, just people who care about evidence and honest debate.

Membership is free!

Create your free account

Back
Top Bottom