gold bull/bear survey

Where do you think the gold price is going?


  • Total voters
    138
When you decide to actually put forth an argument, let me know. Temper tantrums don't count.

I would but I don't invent "billionaire friends" to lend credence to a worthless position. Most of us discard our imaginary friends before Grade 3.
 
That's what I thought. You're not a gold bug. You're moving back and forth and gambling on currency:gold exchange values.

this is a small leveraged Forex account I'm talking about with trading here?

I do hold a core position of (currently) 65/35 gold and silver equivalent to 100% of my net savings, does that count? :)

It seems it's sometimes the €, sometimes the $, and sometimes the £.

I bought my core physical in GBP in 2009.

I have only been trading forex (gold silver oil whatever) on leverage (in USD & Euros) since last Xmas.

How many times do you lose on those gambles?

so far, not a single time on the gold arb, (which is holding my batting average in other areas up no-end lol) ..you just have to wait for the Euro to swing back through the range again. in fact doubling up as the first position goes into loss and the Euro approaches support/resistance works very well, as once the pendulum swings back again you bank the second trade as the first gets back to zero.

and then do it again if you have to, eventually, it has always run back through the area I need to bank the initial trade thus far.

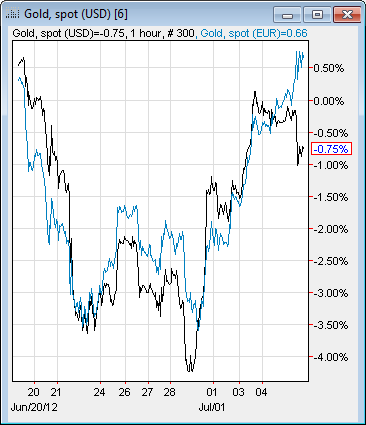
I am looking at charts like this

178524ff5de17d673f.png


its not rocket science, so as of a couple of hours ago Im long gold in USD and short in EUR, until this chart crosses back over again.

It's not the price of gold that's important to a currency trader but the exchange rates. In fact, you really shouldn't care what the per ounce price of gold is as long as there's volatility.

I keep saying (that in non-trading world) I don't care what the number attached to it is, there are so many currencies to price it in, whatever, what I am looking at is historical ratios between gold and other real things, not some arbitrary numbers attached to it.

in trading world, yes of course you're right, I could care less what it actually is as long as it sets up correctly with a trend behind it.
 
rally imminent? (and imminent on a weekly chart is obviously a matter of weeks)

[qimg]http://www.internationalskeptics.com/forums/imagehosting/178524ff4594ad15c0.png[/qimg]

for the record the downdraft on Friday turned the weekly trend negative again so this is invalidated. amateur mistake on my part, not waiting for the week to finish and the trend to lock in first.

and an interesting World Gold Council paper

In this note we show empirical evidence that positive money supply growth accompanies higher gold prices. However, our goal is not to present a forecasting model for the price of gold, but rather show an empirical mechanism in which gold and money supply relate.

.....

Lead-lag relationship to gold

As expected, on an individual basis, money supply growth in each country was positively correlated to percentage changes in the price of gold, ranging from 0.1 to 0.35. However, a more interesting result is that a 6-month to 9-month lag in money supply growth increased the corresponding correlation to a range of 0.15 to 0.4. In other words, there is evidence that money supply growth has an impact on future gold performance.

.........

We find that gold is not only positively correlated to money supply growth, but that the emerging economies included (India and Turkey) are statistically significant and increase the explanatory power of the model without inducing multicolinearity (which occurs when there is a high degree of correlation among the explanatory variables – in this case, money supply growth in all the countries/regions included in the model).
 
its that time again, everything you ever wanted to know in 1 report Erste Group annual report 2012 - Sources: Datastream, Erste Group Research

What does this environment now mean for the gold price? Since our previous “In Gold We Trust” report of early July 2011, gold has set new all time highs in numerous currencies (among others, USD, GBPand EUR).

The following chart illustrates the fact that the last year was merely a consolidation pattern, rather than a top-formation.

That said, we have to be self-critical here, as the price has clearly fallen short of our target of USD 2,000.

The following chart shows that the secular bull trend is intact in both currencies and that at the same time no final trend acceleration has taken place so far.

In August 2011 gold soared from USD 1,600 to USD1,920 within 15 trading days. This might have been the overture to such a parabolic trend acceleration

"The foundation for new all-time-highs is in place. As far as sentiment is concerned, we definitely see no euphoria with respect to gold. Skepticism, fear, and panic are never the final stop of a bull market. In the short run, seasonality seems to argue in favor of a continued sideways movement, but from August onwards gold should enter its seasonally best phase.
 
Last edited:
Slightly o/t .... a friend bought "rather a lot" of gold at ~1900 last year and has been bemoaning his fate ever since. But I check kitco.com sometimes to follow his fortunes.

I notice that sometimes there's a dramatic rise/fall - usually at the opening of NYMEX - that seems unrelated to world economic or political events. What causes this?
 
Slightly o/t .... a friend bought "rather a lot" of gold at ~1900 last year and has been bemoaning his fate ever since. But I check kitco.com sometimes to follow his fortunes.

unfortunate, but its what most people do, ie chase price when its rising fast and buy near the top of the bump. its amazing how people aren't interested when its on 20% sale but get all bullish near the top of big runs. herd behaviour at its finest. he just needs to wait it out, it'll be ok.

the standard pattern would be for him to throw in the towel and take a loss any time now, when sentiment is at its lowest, and then he can watch it run way past where he bought at from the outside, try not to let him do that.

contrary to popular opinion, riding a powerful bull market is not easy money, the "wall of worry" is not called that for no reason.

I notice that sometimes there's a dramatic rise/fall - usually at the opening of NYMEX - that seems unrelated to world economic or political events. What causes this?

good question. presumably you are looking at the USD price? there's often a correlating currency spike on EUR/USD that is the primary driver IMO.

watching price move in both EUR and USD gives a better idea of whether you're just watching currency-related flux, or an actual gold move, the movement is inverse when its currency driven, or in the same direction when it's gold driven.

but the "morning beatdowns" (morning in London, 2-3am US) are well known amongst traders, there are some fairly well established patterns many people trade around.
 
Last edited:
In August 2011 gold soared from USD 1,600 to USD1,920 within 15 trading days...

In the short run, seasonality seems to argue in favor of a continued sideways movement, but from August onwards gold should enter its seasonally best phase.
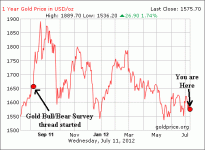
When this thread was started last August, gold appeared to be rising at an ever-accelerating rate. Yet less than 2 months later it crashed back down to where it started, and despite wild oscillations has not recovered. Currently it is trading 5% lower. However...

UndercoverElephant said:
ETA: I'm talking medium and long term here, not where the price is going to be next week.
Any period less than 1 year could be considered 'short-term' and therefore irrelevant (to this discussion), so what gold does in August is crucial (to the results of this poll). I don't know what 'enter its seasonally best phase' is supposed to mean, but if gold turns toward a robust upward trend in August then the 'bulls' may see their position as validated. OTOH, if it continues to decline or 'go sideways' then any rational observer would have to call the bullish predictions 'busted'.

It may take another six months or more before we can be sure that 2011 really was the year that gold 'jumped the shark' in the medium term, and perhaps 5 years or more to see if this bubble extends to 'long term'. For me however, the cutoff point is the end of August, as that is when I decide what to invest in for the next year. Fortunately (literally!) I did not listen to the gold bugs last year, and instead put my money into a boring term deposit at the bank.

So far it looks like I may have gained by playing it safe, but gold still has time to rally and prove its worth. However there's only a few weeks to go, so gold will certainly have to pull its finger out if it wants to attract my attention!

 

Attachments

  • Gold_Aug11-july12.gif
    Gold_Aug11-july12.gif
    14.9 KB · Views: 1
Last edited:
It may take another six months or more before we can be sure that 2011 really was the year that gold 'jumped the shark' in the medium term, and perhaps 5 years or more to see if this bubble extends to 'long term'.

you have yet to supply a single shred of evidence of a "bubble"

For me however, the cutoff point is the end of August, as that is when I decide what to invest in for the next year. Fortunately (literally!) I did not listen to the gold bugs, and put my money into a boring term deposit at the bank.

So far it looks like I may have gained by playing it safe, but gold still has time to rally and prove its worth. However there's only a few weeks to go, so gold will certainly have to pull its finger out if it wants to attract my attention!

love your investing deadlines, do you have to present quarterly accounts too then?

and with regards to attracting your attention, at what price will you be considering buying? .. once the herd and momentum chasers are all fully in again?
 
Last edited:
I don't know what 'enter its seasonally best phase' is supposed to mean, but if gold turns toward a robust upward trend in August then the 'bulls' may see their position as validated. OTOH, if it continues to decline or 'go sideways' then any rational observer would have to call the bullish predictions 'busted'.

with regards to your deadlines, I personally might be thinking about changing them about a bit, taking this into account

The above chart represents the seasonality for Gold Futures (GC) Continuous Contract for the past 20 years.

Date range: January 1, 1990 to December 31, 2009
Gold Futures Continuous Contract Seasonality

Analysis has revealed that with a buy date of September 13 and a sell date of May 23, investors have benefited from a total return of 183.61% over the last 10 years. This scenario has shown positive results in 9 of those periods.

Conversely, the best return over the maximum number of positive periods reveals a buy date of September 16 and a sell date of May 20, producing a total return over the same 10-year range of 159.82% with positive results in 10 of those periods.
 
Last edited:
so far, not a single time on the gold arb, (which is holding my batting average in other areas up no-end lol) ..you just have to wait for the Euro to swing back through the range again. in fact doubling up as the first position goes into loss and the Euro approaches support/resistance works very well, as once the pendulum swings back again you bank the second trade as the first gets back to zero.

and then do it again if you have to, eventually, it has always run back through the area I need to bank the initial trade thus far.

I am looking at charts like this

[qimg]http://www.internationalskeptics.com/forums/imagehosting/178524ff5de17d673f.png[/qimg]

its not rocket science, so as of a couple of hours ago Im long gold in USD and short in EUR, until this chart crosses back over again.

so to update this, because I would not only want to talk about wins, I pulled the plug on this today at -$180, the first loss on 13 trades of this type in total. now that I have done that its more or less certain something will be announced out of the blue that causes a monster Euro spike, however, at the moment it looks like it might just keep going downwards for a while yet.

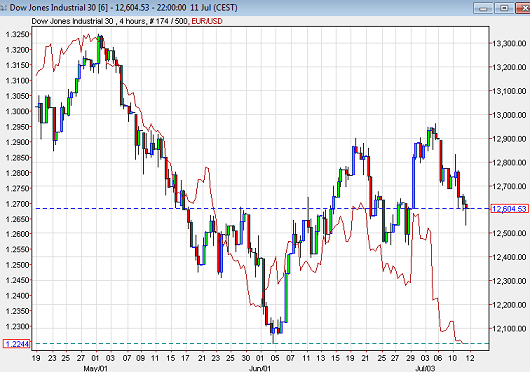
this is the chart that's doing it for me today, this gap is going close, one way or the other, so going to hang on in my Dow shorts at an aggregate on 188 points per contract profit thus far.

178524ffeb2eb6e235.png


youre not supposed to bring emotion or prejudice into trading, however I do have to admit that making digital profit from shorting stocks is without doubt my favourite trade, it feels like the money is coming straight out of The Central Scrutinizer's account and into mine lol.

Im sure he will be along shortly to explain that his stocks are not going down anyway and sophisticated investors understand the equity premium and just dont care.
 
Has Gold Lost its Glimmer?

Gold has been trapped in a range between $1,530 and $1,630 for about two months

"The range is contracting these days and I don't see much encouragement for people to have a big position," said Yuichi Ikemizu, head of commodity trading, Japan, Standard Bank.

"Gold appears to have lost its glimmer," said Tim Riddell, head of ANZ Global Markets Research, Asia. "Daily momentum is flat/neutral as it languishes in the lower reaches of a $1,555-$1,635 range."

Roger Ramjets said:
Gold's performance so far this year has been well below average (only a 9.9% gain, vs 19% average since 2002), and indications are that it will continue to languish through 2012.
 
Gold has been trapped in a range between $1,530 and $1,630 for about two months

"The range is contracting these days and I don't see much encouragement for people to have a big position," said Yuichi Ikemizu, head of commodity trading, Japan, Standard Bank.

"Gold appears to have lost its glimmer," said Tim Riddell, head of ANZ Global Markets Research, Asia. "Daily momentum is flat/neutral as it languishes in the lower reaches of a $1,555-$1,635 range."

hmmm. ..so you realize these people are speaking from a trading perspective, are you trading it? because this really just backs up my question above:

and with regards to attracting your attention, at what price will you be considering buying? .. once the herd and momentum chasers are all fully in again?

in the meantime..

China imports more gold in 5 months than the entire UK holdings

and the smart money goes net long gold for like only the 3rd time ever, the previous time was prior to the last run up to $1900..

http://www.gotgoldreport.com/2012/07/comex-swap-dealers-net-long-gold-for-third-time-ever.html

:boxedin: <-- this is you, need need to learn to think outside of it ;)
 
meanwhile in Euroland

they are currently taking their turn at devaluing their Fiatus Digitalis

17852500a83f00ca80.png


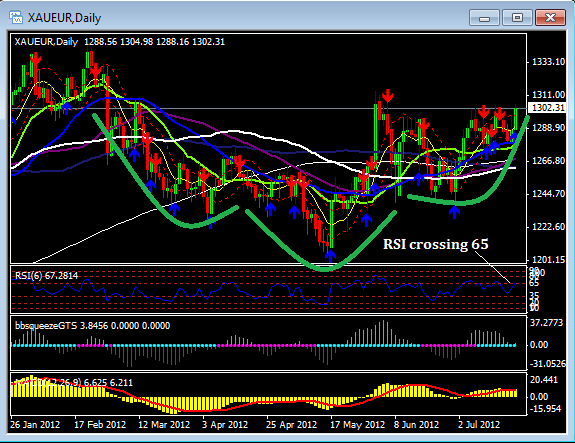
gold in Euros has set up an upside down head & shoulders and is at the neckline looking to be on the point of breaking out, if the Euro continues to weaken we will see new all time highs in Fiatus Euros pretty quickly, these patterns are usually powerful when they fire off.

so how long do we think the Bernank can hold out against his primal Ctl-P urges when everybody else is playing without him? :D

he's in a catch 22 lose-lose situation really now, with most US indicators horrible and turning down, a further strengthening dollar is not what they need, and if they do not QE shortly US equities have an imminent date with reality.

election politics makes timing awkward. if they do it, they'll be accused of helping incumbents, but I don't think incumbents would sit by and watch another swoon like last summer with an election in months.

but the markets have already pre-priced some of this in, on top of all the previous flow. if the market comes to actually believe that Benny and the Inkjets are not going to print and the Bernanke Put is really no more.. lookout below, for everything, but in particular the QE blown bubbles.

this is why he has to do it IMO, but if he does and it's a disappointment in any way then lookout below anyway.

http://trimtabs.com/blog/2012/07/18...-drops-housing-values-post-next-bernanke-put/


At the top of the bubble households had $13 trillion in home equity and $14 trillion in stocks. Now home equity have been cut in half to $6.5 trillion; yet stocks are just a trillion less then at the peak.

there's your Wall St / Main St divide, right there. Powered by QE2Infinity&Beyond!! (TM)

To repeat, homes remain in the crapper due to extremely tight credit conditions. Stocks are in the penthouse because the Fed has giving zero cost money to Wall Street and the banks.

When the prospect of another Fed easing no longer runs up stock prices, the stock market will have no place to go but down, and down big time.
 
Last edited:
MoneyMorning Australia is again talking up China's involvement in gold prices. China’s Big Move Could be a Game-Changer for Gold.

What I like in this article is the brief precis of modern financial history:
In 1946, the Bretton Woods agreement enabled a fixed exchange rate. It meant that you could exchange your US dollars for gold. The going rate was $35 per ounce for several decades. President Richard Nixon ended this system in 1971. From that point on, only faith in the American government was behind the greenback.

And what happened to gold? Soaring inflation (around 11% by 1979) enabled gold to rally over the next decade from $35 an ounce to more than $850 an ounce.

As the decadent eighties rolled in, all sorts of fancy financial tools were developed. These were the investing tools for the modern man. You could leverage yourself to the eyeballs.

After all, why buy something as simple as gold when there are complicated financial tools like swaps, futures, options, Forex, warrants, bonds and stocks to invest in?

This has led the modern man, with all his fancy financial products, to sneer at gold investors. He sees them as people who refuse to move with the times. The sort of people who were most likely your Great Depression surviving grandparents.


In another article titled, The Dutch Anomaly, the author points out that yeilds for bonds are at record lows which suggests that investors fear the Euro so greatly that they are seeking safety.

In the event that the investors' worst fears are realized, this would send gold and silver stocks soaring.
 
Last edited:
there's no doubt things are changing fast, and (IMO) China are most definitely heading towards either gold-backed or "gold-involved" currency in one form or another

I think this sums it up:

So: is gold fairly valued at $1,000, at $1,600 or at $10,000... Or is that question even relevant any more as the part of the world that is not broke is quietly shifting to it as its default currency?
 
In the event that the investors' worst fears are realized, this would send gold and silver stocks soaring.

Gold and silver stocks have languished in recent years (I know because I'm unfortunate enough to have owned them) in favor of highly liquid ETFs like GLD, SLV, PHYS, and PSLV, as well as the metals themselves. I have the opinion that physical metals are going to decouple from derivatives including stocks as it becomes apparent that many paper and electronic gold investors are simply victims of naked short sellers who cannot possibly cover.

I myself am pretty worried about this as I am exposed to some of that risk. I view it as a highly dangerous game of musical chairs, and the music is almost over.
 
Last edited:
Gold and silver stocks have languished in recent years (I know because I'm unfortunate enough to have owned them) in favor of highly liquid ETFs like GLD, SLV, PHYS, and PSLV, as well as the metals themselves. I have the opinion that physical metals are going to decouple from derivatives including stocks as it becomes apparent that many paper and electronic gold investors are simply victims of naked short sellers who cannot possibly cover.

I myself am pretty worried about this as I am exposed to some of that risk. I view it as a highly dangerous game of musical chairs, and the music is almost over.
I suspect that after the great reset, digital gold and silver will disappear and the bullion holders will be inviting me to their party. (Please?)
 
Gold and silver stocks have languished in recent years (I know because I'm unfortunate enough to have owned them) in favor of highly liquid ETFs like GLD, SLV, PHYS, and PSLV, as well as the metals themselves. I have the opinion that physical metals are going to decouple from derivatives including stocks as it becomes apparent that many paper and electronic gold investors are simply victims of naked short sellers who cannot possibly cover.

I myself am pretty worried about this as I am exposed to some of that risk. I view it as a highly dangerous game of musical chairs, and the music is almost over.

Indeed I think you should be concerned, IMO this is quite possibly a close relative of the next real black swan to strike.
 
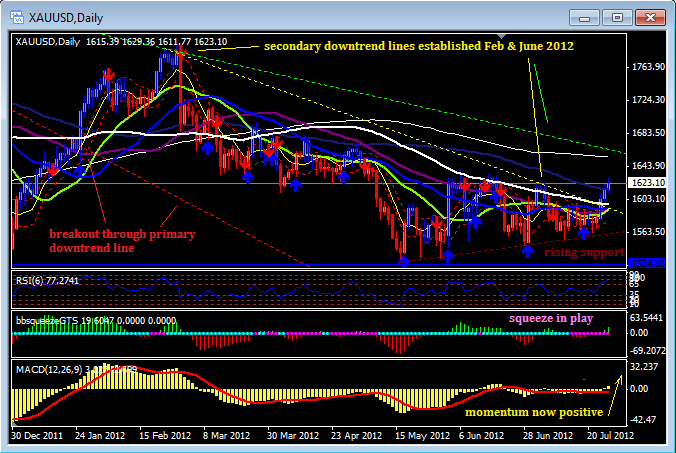
bullishness update - status "quite"

rally imminent? (and imminent on a weekly chart is obviously a matter of weeks)

this is a daily chart, and it has started, although we're only in the $1620's, at this point this is quite significant because to get there it had to break out through several important moving averages (the cluster now below the price, which will now act as support, instead of resistance) and 2 longer term downtrend lines.

17852501504067fcb2.png


if we run through the 200 day MA (white above current price) and the last green downtrend line, it will be off to the races as all the hot momentum money piles in again.

of course, as ever, it's all dependent on whether or not Benny puts his ball-bearing on the zero key again following the Jackson Hole meetings on 01 August.

If he doesn't, we'll be back lower again, possibly sub $1500s, but I will be short US stocks at approx 3:1 the amount my PMs might drop, Dow <10k again here we come :)
 
Last edited:

ISF - Join now!

Every member here is approved by hand. No bots, no spam, just people who care about evidence and honest debate.

Membership is free!

Create your free account

Back
Top Bottom