• Due to ongoing issues caused by Search, it has been temporarily disabled
  • Please excuse the mess, we're moving the furniture and restructuring the forum categories

How do we know a pandemic's over?

Case numbers are reported but only when tests are done by a medical center and most tests are not. Most people now test at home with a rapid test. They just isolate 5 days and if positive and older, they can call their doctor and get Paxlovid. None of these become cases. Not something new. This has been true since early 2022.

Mandatory Covid hospitalization reporting ceased May 1. It (and Flu reporting) will resume on Nov 1 for the expected winter season. As a result, only about 1/3 of hospitals report so the total number of hospitalizations is a big undercount. That's why the CDC reports hospitalizations per 100k people. This is relative to the service population so not affected by dropping mandatory reporting. If you look at those charts there was no sudden drop in May.
I was meaning reporting as in giving the public reports on what is going on, estimated case numbers etc. Generally, you have to look for this info.


Are most people even home testing these days or isolating? The "expected winter season" is the sort of inaccurate information a lot of people believe about Covid - well, those who don't just think it's either entirely over or no worse than a cold now.
 
I was meaning reporting as in giving the public reports on what is going on, estimated case numbers etc. Generally, you have to look for this info.

Check out CDC's site:
https://covid.cdc.gov/covid-data-tracker/#datatracker-home

You can drill down for more detailed info. But keep in mind that Covid cases are only those that show up at medical facilities to get tested. Few do. Even most people that get covid at places like CIDRAP don't. The just use the home tests that are free. The ones that test positive then get sick enough to go to an urgent care or hospital will be tested again and then become cases.


Are most people even home testing these days or isolating? The "expected winter season" is the sort of inaccurate information a lot of people believe about Covid - well, those who don't just think it's either entirely over or no worse than a cold now.

Covid, unlike Flu, tends to have waves during both the summer and winter but so far the winter waves have each been more serious than summer waves. At least in terms of deaths. They have also been gradually decreasing since the winter of 2021/22. At least in the US.

Note also that while this summer's Covid-19 infection surge has been really high, it's not anywhere near as bad as a typical Flu season at its peak in Jan/Feb where we would typically be running 5k or more deaths per week. OTOH, Covid-19 tends to spread out year round and not concentrated in a few months like Flu. Covid does more damage over the year even though it doesn't stress hospitals as much as Flu does in the winter.
 
Last edited:
It is grotesque that the only (electoral) alternative to this insanity is the MAGA candidate. And the third option is even more committed to his antivaxxer creed.
Reality is that which, when you stop believing in it, doesn't go away - no matter how firm that belief is, and as the DNC shows, it seems to be unshakeable at this point.

Any mitigation or even reporting of the current USA infection rates seems to be regarded as an election loser in a tight and highly significant election season. As a result, most people aren't even aware of the high case numbers.
Thanks for sharing your research, dann.
As you have probably noticed, the MAGA candidate won and put the third option, the antivaxxer, in charge of MAHA, and the MAHA guy has already been humiliated in public by the orange fatty for criticizing his diet.
The Trump administration also considers another crank as the leader of the NIH (InsideHigherEd, Nov 18, 2024), Jay Bhattacharya of Great Barrington notoriety.
I expect that Alex Jones will be appointed as CEO of Minitruth, so very soon the pandemic will not only be over, as claimed again and again in this forum. It will never have existed as anything other than a vicious rumor - or maybe as a psychosis as Belarusian strongman Lukashenko used to say.
 
Last edited:
Covid, unlike Flu, tends to have waves during both the summer and winter but so far the winter waves have each been more serious than summer waves. At least in terms of deaths. They have also been gradually decreasing since the winter of 2021/22. At least in the US.

Note also that while this summer's Covid-19 infection surge has been really high, it's not anywhere near as bad as a typical Flu season at its peak in Jan/Feb where we would typically be running 5k or more deaths per week. OTOH, Covid-19 tends to spread out year round and not concentrated in a few months like Flu. Covid does more damage over the year even though it doesn't stress hospitals as much as Flu does in the winter.

So let's take a look at the actual numbers, to the extent that they are still accessible:
The same media getting hysterical about RFK destroying public health platformed people who gave us RFK-like talking points like 'covid is just the flu' and now none of them will tell you 4,745 Americans died of covid this September and just 125 died of flu.
Nate Bear on X (Nov 17, 2024)
Nate Bear presents a graph of Influenza vs. COVID deaths per month where either contributes to death; also COVID wastewater measures. Apr 2022-Sep 2024 as of 10/19/2024.
He has the graph from Gregory Travis (Nov 5, 2024), one of the many X users who are leaving Musk's platform for Bluesky:
Weekly COVID vs. Influenza report
Sept 2024:
126 Influenza deaths
4,803 COVID deaths (38x influenza)
2024-to-date:
7,931 total Influenza deaths 41,749 COVID deaths

Reality is obviously still that which, when you stop believing in it or try to obfuscate it, doesn't go away.
 
As you have probably noticed, the MAGA candidate won and put the third option, the antivaxxer, in charge of MAHA, and the MAHA guy has already been humiliated in public by the orange fatty for criticizing his diet.
The Trump administration also considers another crank as the leader of the NIH (InsideHigherEd, Nov 18, 2024), Jay Bhattacharya of Great Barrington notoriety.
I expect that Alex Jones will be appointed as CEO of Minitruth, so very soon the pandemic will not only be over, as claimed again and again in this forum. It will never have existed as anything other than a vicious rumor - or maybe as a psychosis as Belarusian strongman Lukashenko used to say.


Yepp, countdown to crazy, in many more ways than just one
 
"Some people will argue the pandemic isn't over in 3...2...1..."
I'm one of those people. I argue based on facts instead of fabulation.
while this summer's Covid-19 infection surge has been really high, it's not anywhere near as bad as a typical Flu season at its peak in Jan/Feb where we would typically be running 5k or more deaths per week. OTOH, Covid-19 tends to spread out year round and not concentrated in a few months like Flu. Covid does more damage over the year even though it doesn't stress hospitals as much as Flu does in the winter.
Can you show us the numbers to back up your claim, marting?
Do you still remember your claim from last year about COVID-19 and the flu?
Have you considered that some of the precautions people, e.g. The Atheist and his son, still take against the pandemic also work against the flu?
Have you considered that this may be a reason why the flu refuses to live up to your expectations?
 
Yepp, countdown to crazy, in many more ways than just one
Let me count (some of) the ways:
Trump's picks to lead US health agencies:
HHS - Robert F. Kennedy Jr.
NIH - Jay Bhattacharya
CMS - Mehmet Oz
CDC - Joseph Ladapo (TBC)
FDA - Marty Makary (TBC)
Surgeon General - Casey Means/Vinay Prasad (TBC)
Dr. Lucky Tran on X, Nov 19, 2024
Based on Trump transition closes in on picks for top health posts (Politico, Nov 19, 2024)
I don't see Oz mentioned in the Politico article, but others are mentioned, for instance:
Aaron Siri, the managing partner of a law firm closely tied to the anti-vaccine movement, is also in the mix as a potential pick for HHS general counsel. Siri and his firm played a central role in challenging vaccine mandates at various schools and workplaces during the pandemic.
 
Oz is also mentioned here, so probably correct:
Trump names Dr. Mehmet Oz to head Centers for Medicare and Medicaid Services (CNN, Nov 19, 2024)
His views on Covid-19, however, sparked controversy. Early on in the pandemic, for instance, Oz talked up the antimalarial drug hydroxychloroquine as a way to treat the coronavirus — despite the lack of firm scientific evidence that it was an effective treatment.
Many of those perspectives were praised by Republicans at the time.
 
Can you show us the numbers to back up your claim, marting?
See below
Do you still remember your claim from last year about COVID-19 and the flu?
I've made lots of observations. Are you thinking about the observation in San Diego County that Covid-19 was hitting the elderly much harder but younger cohorts were impacted similarly. A change from the earlier 2 years where all age groups were getting hit hard by Covid-19?
Have you considered that some of the precautions people, e.g. The Atheist and his son, still take against the pandemic also work against the flu?
Have you considered that this may be a reason why the flu refuses to live up to your expectations?
Of course. It's been pretty obvious since the early days of the pandemic that the NPIs people were using had a much greater effect on reducing flu levels than Covid-19. Flu has lower R0s. Pretty sure I made that point a long time ago.
Note also that while this summer's Covid-19 infection surge has been really high, it's not anywhere near as bad as a typical Flu season at its peak in Jan/Feb where we would typically be running 5k or more deaths per week. OTOH, Covid-19 tends to spread out year round and not concentrated in a few months like Flu. Covid does more damage over the year even though it doesn't stress hospitals as much as Flu does in the winter.

The 5k was an estimate based on looking at flu season waves and CDC flu mortality estimates. The CDC does not have anywhere near accurate data on deaths initiated by flu since by the time people are hospitalized it has often evolved into pneumonia. What the CDC does have is estimates for influenza caused mortality going back decades. This includes point value estimates with 95% confidence intervals. Death certificate data on flu is close to meaningless. The CDC does publish flu hospitalization data from which we can look at the week by week hospitalizations. The peak can be located by finding the week with the largest hospitalization change. Deaths can then be reasonably inferred by that fraction compared to the total in that season.

For instance, take the 2010-11 flu season. The point estimate for flu is 36,000 deaths. Roughly the median estimate in the decade before Covid-19. However, the 95% confidence ranged from 21,000 to 140,000. A sad state of affairs about our ability understand flu's impact.

Looking at the hospitalizations of those 65+, we see the peak week hospitalization was 13% of the 2010-11 flu season. Since the point estimate was 36,000, and assuming deaths roughly tracked hospitalizations, that yields just over 4700 deaths per week at the peak for the point estimate. For the lower CI estimate it would be 2700/week and for the higher CI estimate it would be 10200/week.

Refs:
 
Last edited:
Good news here in New Zealand - after months of nothing, data visualizations are back! Covid numbers seem to be staying down which is good news. But people are still getting it. Just this week a friend of mine announced that his wife had it, on the same day that he had been visiting me.

The updated graphs are interesting. We see that there was a big surge in reinfections in June, and they are currently running at 72% of the total (reported) cases. This suggests the same people are getting it again and again. Immunity (whether through vaccines or prior infection) doesn't seem to be working for them. We also see a little blip in November, just to remind us that the virus hasn't gone away. Hospitalizations show a similar trend.

However it is officially 'over' in New Zealand. Last month I collected another box of free RATs from the local pharmacy, on the last day they wee being offered. When asked how many I wanted I said one box will be fine. The girl at the counter seemed a bit disappointed. This just confirms what we all know, most people aren't even testing now.

It's not all good news though. Hawkes Bay is for the first time leading the pack with 18 cases per 100k, almost double the next largest region. That's twice what it was in June. I'm now in the epicenter of the latest surge!
 
See below

I've made lots of observations. Are you thinking about the observation in San Diego County that Covid-19 was hitting the elderly much harder but younger cohorts were impacted similarly. A change from the earlier 2 years where all age groups were getting hit hard by Covid-19?

Yes, marting has made lots of observations, and, no, this is not the one I was thinking of, which he knows but prefers not to acknowledge.
See post 929 and post 931 about marting's false claims and predictions last year.

Of course. It's been pretty obvious since the early days of the pandemic that the NPIs people were using had a much greater effect on reducing flu levels than Covid-19. Flu has lower R0s. Pretty sure I made that point a long time ago.
The point marting needs to realize is that NPIs not only had a much greater effect on reducing flu levels than Covid-19. It still has!
And the flu not only has lower R0s. It is also less virulent than COVID-19.

The 5k was an estimate based on looking at flu season waves and CDC flu mortality estimates. The CDC does not have anywhere near accurate data on deaths initiated by flu since by the time people are hospitalized it has often evolved into pneumonia. What the CDC does have is estimates for influenza caused mortality going back decades. This includes point value estimates with 95% confidence intervals. Death certificate data on flu is close to meaningless. The CDC does publish flu hospitalization data from which we can look at the week by week hospitalizations. The peak can be located by finding the week with the largest hospitalization change. Deaths can then be reasonably inferred by that fraction compared to the total in that season.

For instance, take the 2010-11 flu season. The point estimate for flu is 36,000 deaths. Roughly the median estimate in the decade before Covid-19. However, the 95% confidence ranged from 21,000 to 140,000. A sad state of affairs about our ability understand flu's impact.

Looking at the hospitalizations of those 65+, we see the peak week hospitalization was 13% of the 2010-11 flu season. Since the point estimate was 36,000, and assuming deaths roughly tracked hospitalizations, that yields just over 4700 deaths per week at the peak for the point estimate. For the lower CI estimate it would be 2700/week and for the higher CI estimate it would be 10200/week.

Refs:

"For instance, take the 2010-11 flu season."
So marting's claim that COVID-19 "doesn't stress hospitals as much as Flu does in the winter" is based on numbers from the 2010-11 flu season, i.e. a very loooong time before COVID-19 appeared!
Apparently, anything will do to minimize the impact of the current pandemic.

while this summer's Covid-19 infection surge has been really high, it's not anywhere near as bad as a typical Flu season at its peak in Jan/Feb where we would typically be running 5k or more deaths per week. OTOH, Covid-19 tends to spread out year round and not concentrated in a few months like Flu. Covid does more damage over the year even though it doesn't stress hospitals as much as Flu does in the winter.

COVID-19 not only does more damage over the year, it also stresses hospitals more than the flu does in the winter. The only point of denying this fact is as an attempt to minimize the reality of COVID-19's impact on people's health and lives ... and hospitals.
 
Good news here in New Zealand - after months of nothing, data visualizations are back! Covid numbers seem to be staying down which is good news. But people are still getting it. Just this week a friend of mine announced that his wife had it, on the same day that he had been visiting me.

The updated graphs are interesting. We see that there was a big surge in reinfections in June, and they are currently running at 72% of the total (reported) cases. This suggests the same people are getting it again and again. Immunity (whether through vaccines or prior infection) doesn't seem to be working for them. We also see a little blip in November, just to remind us that the virus hasn't gone away. Hospitalizations show a similar trend.

However it is officially 'over' in New Zealand. Last month I collected another box of free RATs from the local pharmacy, on the last day they wee being offered. When asked how many I wanted I said one box will be fine. The girl at the counter seemed a bit disappointed. This just confirms what we all know, most people aren't even testing now.

It's not all good news though. Hawkes Bay is for the first time leading the pack with 18 cases per 100k, almost double the next largest region. That's twice what it was in June. I'm now in the epicenter of the latest surge!

I guess there's reason to assume that the actual percentage of reinfections is considerably higher than 72% since only people who were tested and registered the first time around will be registered as being reinfected. I also assume that the "18 cases per 100k" is based on people being tested in hospitals only, i.e. much like in the rest of the world at this point.
I notice that the percentage of reinfections in the age group 80 to 89 is 100%! I don't think there's reason to assume that the percentage of reinfections IRL is only (!) 88% in 10-to-19-year-olds. They just don't get tested as much as 80+. It's peculiar that, of all age groups, the percentage is lowest in 70-to-79-year-olds. Could it be because they are more likely to take precautions like staying away from restaurants, cinemas and other indoor public places?
I notice that the age group with the third-highest number of of hospitalized cases is 0-to-9-year-olds. I guess that it's probably much like Denmark in this respect, i.e. that it will mainly be 0-2-year-olds and in particular those whose mothers weren't vaccinated during pregnancy.
 
I took a two-month hiatus from the ISF because I was fed up with trying to keep abreast of the pandemic in different parts of the world.
Now that I'm back, I'm happy see that Hong Kong doesn't pretend that it's over or that 'the world has moved on':
Secretary for Health receives vaccinations against seasonal influenza and COVID-19 (with photos) (info.gov.hk, Sep 24, 2024)
I love the photos, in particular. Other health authorities could learn from Hong Kong's example! (But Hong Kong's HCWs could do with an upgrade from surgical masks.)
 
In San Diego so far, June 30 to Nov 23, there have been 169 C19 deaths (flu: 7, RSV: 0).
San Diego County Respiratory Virus Surveillance Report (Nov 27, 2024)
The current numbers appear to be lower than they were in July-August.

The situation in Denmark is similar in this respect. Last week the numbers were lower than they have been since early June.
Overvågning af influenza, covid-19, RS-virus og andre luftvejssygdomme (SSI.dk, Nov 27, 2024)
Covid-19 - Danmark (Region) (Nov 26, 2024)
Yeah. Covid-19 has dropped and plateaued at pretty low levels. Seems XEC isn't really growing as much as prior leading variants. R0 looks like only a bit over 1 while the other variants are all well under 1. Just doesn't seem to be growing as rapidly as the other large wave producing ones. Wouldn't surprise me if the Winter wave, which has been the dominant one since 2020, comes out less than the Summer wave. Flu appears to just be ramping strongly. More than doubled in the last 2 weeks from its typical low off season. Time to get the Flu shot. Given the short number of months both the Flu and Covid shots provide protection, I'm going to wait until I see a similar ramp start on Covid-19.

On another note. It really irritates me when I look at a chart clearly labeled incorrectly. Check out page 10 of the SDCRVSR. Here:

Figure 17. Percent of Total Deaths Associated with COVID-19
% of Deaths due to COVID-19 7-Day Average

The last line obviously should read: "% of Deaths due to COVID-19 7-Week Average"
 
I guess there's reason to assume that the actual percentage of reinfections is considerably higher than 72% since only people who were tested and registered the first time around will be registered as being reinfected. I also assume that the "18 cases per 100k" is based on people being tested in hospitals only, i.e. much like in the rest of the world at this point.
I notice that the percentage of reinfections in the age group 80 to 89 is 100%! I don't think there's reason to assume that the percentage of reinfections IRL is only (!) 88% in 10-to-19-year-olds. They just don't get tested as much as 80+. It's peculiar that, of all age groups, the percentage is lowest in 70-to-79-year-olds. Could it be because they are more likely to take precautions like staying away from restaurants, cinemas and other indoor public places?
I notice that the age group with the third-highest number of of hospitalized cases is 0-to-9-year-olds. I guess that it's probably much like Denmark in this respect, i.e. that it will mainly be 0-2-year-olds and in particular those whose mothers weren't vaccinated during pregnancy.
Can't really make any assumptions except that obviously many people are not reporting. However wastewater doesn't lie, and it's staying relatively constant which suggests the actual case numbers are too. Only problem for me is that the concentration in Hawkes bay is much higher than the rest of the country.

Latest update from here is that my friend's wife and daughter got over it, but now his 4 year old son has it from a different source. His other son is also home because two teachers at school have it. He's supposed to be going on a business trip by airplane on Friday, but that won't happen unless the whole family is covid-free by then. It also means the activities we were planning on doing together are cancelled. So in a real sense Covid is not over for us. I'm not going anywhere except the supermarket now. Christmas is coming and many people will have relatives visiting, to spread it around the country - in the middle of summer!

I haven't had Covid yet, and with any luck never will. Being fully retired (from 1st November) helps there, as well as not going out except for essential supplies. So for me it's pretty much the same as it was back in 2020 when we were locked down - minus the one-at-a-time queues at the supermarket. Of course I'm keeping my vaccinations up to date, so hopefully that is helping too. But my dream of it being actually over by Christmas is not likey to come true.
 
I guess there's reason to assume that the actual percentage of reinfections is considerably higher than 72% since only people who were tested and registered the first time around will be registered as being reinfected. I also assume that the "18 cases per 100k" is based on people being tested in hospitals only, i.e. much like in the rest of the world at this point.
I notice that the percentage of reinfections in the age group 80 to 89 is 100%! I don't think there's reason to assume that the percentage of reinfections IRL is only (!) 88% in 10-to-19-year-olds. They just don't get tested as much as 80+. It's peculiar that, of all age groups, the percentage is lowest in 70-to-79-year-olds. Could it be because they are more likely to take precautions like staying away from restaurants, cinemas and other indoor public places?
I notice that the age group with the third-highest number of of hospitalized cases is 0-to-9-year-olds. I guess that it's probably much like Denmark in this respect, i.e. that it will mainly be 0-2-year-olds and in particular those whose mothers weren't vaccinated during pregnancy.
Don't read too much into those percentages. It's a daily snapshot with very low numbers. There are only 3 people 80-89 and 8 in the 10-19 age groups.
 
Yeah. Covid-19 has dropped and plateaued at pretty low levels. Seems XEC isn't really growing as much as prior leading variants. R0 looks like only a bit over 1 while the other variants are all well under 1. Just doesn't seem to be growing as rapidly as the other large wave producing ones. Wouldn't surprise me if the Winter wave, which has been the dominant one since 2020, comes out less than the Summer wave. Flu appears to just be ramping strongly. More than doubled in the last 2 weeks from its typical low off season. Time to get the Flu shot. Given the short number of months both the Flu and Covid shots provide protection, I'm going to wait until I see a similar ramp start on Covid-19.

Flu has overtaken C19 case-wise (fig. 1.1 &1.2), even considering the different y-axes. It's unfortunate that there are no hospitalization data since week 39 (fig. 3 & 4).
I think I would recommend getting a C19 jab now and then maybe again in late winter/early spring. In Denmark, there can be only one. C19 is seasonal here - even when it isn't.
Many more people in San Diego (all age groups) have had the flu shot than the C19 shot (figures 23 & 24). I guess the anti-mRNA-vaxxers have been successful.
As for variant data, see figure 32. XEC may not be growing as fast as the dominant Omicron variants of previous years, but it is growing.
However, it would be nice with a winter without the death toll of recent years. I assume HCWs will appreciate it even more than the rest of us.
 
Can't really make any assumptions except that obviously many people are not reporting. However wastewater doesn't lie, and it's staying relatively constant which suggests the actual case numbers are too.
I'm not so sure about wastewater telling the truth. I don't think it can tell us if a rise is due to more people being infected or each case producing more virus. It also can't tell us about new infections versus reinfections.
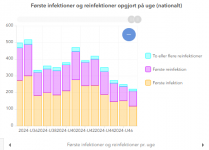
I have found a Danish graph of new C19 cases distinguishing between first infections (orange), first reinfections (purple) and two or more reinfections (pale blue). It is almost impossible to read the numbers, but the graph (nowadays based exclusively on hospital numbers, I assume) is now completely pale blue!
Doesn't really matter. Reinfections are just proof that new variants are getting past prior immunity, which is no surprise. Being weighted towards people who produce more virus is good, because it's a better indication of virulence. The people who are getting really ill from it are what matters most.

Latest update from here - half the kids at my friend's son's kindy are now off sick with Covid. Looks like this surge has a way to go before it peaks.
 
Doesn't really matter. Reinfections are just proof that new variants are getting past prior immunity, which is no surprise. Being weighted towards people who produce more virus is good, because it's a better indication of virulence. The people who are getting really ill from it are what matters most.
I don't think it's good that we no longer know approximately how many people are infected and thus contageous. It's no doubt important that some people get really ill (and some still die) from this, but the number of asymptomatic people isn't unimportant. They are the Typhoid Marys of SARS-CoV-2 and the ones that it is most difficult to take precautions against for the most vulnerable of us.
Latest update from here - half the kids at my friend's son's kindy are now off sick with Covid. Looks like this surge has a way to go before it peaks.
And mentioned in my tweet on Sunday, the number of cases (based on wastewater), hospitalizations and deaths has been decreasing in Denmark recently even though winter has begun, but you say that they appear to be increasing in New Zealand even though summer has just started.
Maybe SARS-CoV-2 is trying to turn into a seasonal virus but wants to avoid competing with the flu.
 
I'm not so sure about wastewater telling the truth. I don't think it can tell us if a rise is due to more people being infected or each case producing more virus. It also can't tell us about new infections versus reinfections.
I have found a Danish graph of new C19 cases distinguishing between first infections (orange), first reinfections (purple) and two or more reinfections (pale blue). It is almost impossible to read the numbers, but the graph (nowadays based exclusively on hospital numbers, I assume) is now completely pale blue!
Are you sure? This is a screenshot from there
1733314773591.png
For week 46, 120 first (recorded) infections, 91 first reinfection, 11 "two or more" reinfections.
Given the lack of testing I've my doubts that this is at all meaningful anyway.
 
Thank you.
No, now I'm not sure at all! Can you tell me how you did that?
I haven't been able to enhance that part of the graph (most recent weeks) to more than a little less than 1 millimeter for all three of them - unlike the winter of 2021-22 when it was huge because everybody was tested - and that less-than-1 millimeter looks entirely pale blue. A few weeks ago, it had a little purple at the bottom.

The distribution of first, second and third+ infection is only meaningful if you assume that hospitalized people are representative in this respect, but there's no way to know if they are.
You also never know how many previous C19 infections people have had when testing and reporting is as rare as it is now.
The graph of PCR- og antigen test pr. uge (number of tests per week) makes it apparent how much things have changed in this respect.
 
Last edited:
Thank you.
No, now I'm not sure at all! Can you tell me how you did that?
I haven't been able to enhance that part of the graph (most recent weeks) to more than a little less than 1 millimeter for all three of them - unlike the winter of 2021-22 when it was huge because everybody was tested - and that less-than-1 millimeter looks entirely pale blue. A few weeks ago, it had a little purple at the bottom.

The distribution of first, second and third+ infection is only meaningful if you assume that hospitalized people are representative in this respect, but there's no way to know if they are.
You also never know how many previous C19 infections people have had when testing and reporting is as rare as it is now.
The graph of PCR- og antigen test pr. uge (number of tests per week) makes it apparent how much things have changed in this respect.
Top right graph. Arrows at the bottom of it to choose different data. There's a bar at the top of the graph (light grey so not very obvious) that allows you to change the time period the graph covers.
 
Meanwhile I have just managed to get Covid for the first time.
 
Meanwhile I have just managed to get Covid for the first time.

Not come down bad, I hope?

(Difficult to know who's actually got Covid these days. No one seems to bother testing any more, not when symptoms are mild. Thankfully, most times they are. Hopefully yours are too.)
 
Not come down bad, I hope?

(Difficult to know who's actually got Covid these days. No one seems to bother testing any more, not when symptoms are mild. Thankfully, most times they are. Hopefully yours are too.)
Not too bad, nasty temperature and symptoms of a bad cold, but bad enough that I did suspect it and doddecide to take an LFT.

I did get a booster in October, with my flu jab, so I am pleased about that.
 
Top right graph. Arrows at the bottom of it to choose different data. There's a bar at the top of the graph (light grey so not very obvious) that allows you to change the time period the graph covers.
Yes, it's like the bar at the bottom of the screen of the graphs at Our World of Data (OWD), except that, unlike with the OWD bar, I may have noticed that the grey bar was there, but I never realized that it served a purpose.
It also comes in handy when focussing on the graph of the C19 death toll.
Now I'm just wondering what makes the narrow line appear to be pale blue before you use the bar to narrow the perspective down to recent weeks. :)
 
(....) No one seems to bother testing any more, not when symptoms are mild. (...)
It's not just when symptoms are mild. It's also when symptoms are different from what people expect.
Friends of mine - a whole family, actually: baby, parents, grandparents - recently came down with gastrointestinal symptoms and ascribed it to norovirus and never even considered testing.
However, a norovirus infection doesn't usually last longer than a day or two, and in this case it lingered for more than a week.
It's obviously impossible to say what it may have been, but ...
What do we know about covid-19's effects on the gut? (Nebraska Medicine/BMJ, May 1, 2024)
Lack of appetite, nausea, vomiting, diarrhoea, and abdominal pain. These may not be the symptoms people expect with covid, but around 50% of people experience them after SARS-CoV-2 infection, and in some people they’re the only symptoms. Gastrointestinal (GI) symptoms may be the first sign of infection or may develop later and persist as part of long covid.
(...)
So, clinicians need to be aware that GI symptoms may be a person’s only sign of covid infection and that lingering gut symptoms could be a part of long covid, rather than having any other cause. But the good news is that a diverse microbiome could help to minimise the likelihood of severe or lasting GI symptoms from covid
 
And now my friend has Covid. Came home on the plane from Auckland and lots of people were coughing. Oh yay, another Covid Christmas!

Christmas conundrums, from gifts to parties to avoiding Covid: What you need to know
Wastewater data suggests we're still seeing elevated rates of Covid-19 infections heading into the holiday season.

Canterbury University Covid-19 modeller Professor Michael Plank said the virus is settling into a cycle of peaks and troughs typical of endemic diseases. But unlike the flu, for example, it hasn't fallen into a seasonal pattern - in New Zealand or overseas - with a predictable winter peak. Partly because Covid is more infectious than influenza.

"But of course it's affected as well by contact patterns," Plank adds.
Case numbers have increased "notably" over the last month or two, he says, although they appear to be coming down again. "It's possible we've passed the peak of this wave." However, it's also possible the mixing and travelling that often occurs at this time of year may reverse that trend.

Epidemiologist Professor Michael Baker says even if the current "fifth wave" has peaked, a lot of people will get infected between now and Christmas.
But hang on, that was last year! And here we are again...
 
And now my friend has Covid. Came home on the plane from Auckland and lots of people were coughing. Oh yay, another Covid Christmas!

Christmas conundrums, from gifts to parties to avoiding Covid: What you need to know

But hang on, that was last year! And here we are again...
Have they gone into any statistics about infection? Because there isn't here. Hospital admissions aren't even routinely tested; I was visiting a hospital a lot before I got COVID, and I don't think that is a coincidence.
 
There is every reason to think that It wasn't a coincidence, jimbob. Nosocomial is the word of the season.
Yes, I know! I had to look it up after I saw it for the third or fourth time in a context that made me realize that it didn't mean nose-related.
Reinstating masking curbs hospital viral outbreak, study confirms (NewsMedical, Dec 1, 2024)
Reinstating masking for healthcare workers alone during a respiratory viral surge resulted in a 33% decrease in hospital-acquired respiratory infections, underscoring its targeted effectiveness.
(...)
During the period of universal masking and testing, hospital-onset infections accounted for 2.9% of the weekly ratio to community-onset cases. This ratio increased to 15.5% after these measures ended and subsequently decreased to 8% following the reintroduction of healthcare worker masking.
Specifically, a 25% rise in hospital-acquired infections was observed after masking and testing measures were discontinued. Thereafter, a 33% reduction was observed after healthcare workers resumed masking.
The cough that dare not say its name (at least not in headlines ...)
Flu cases make NHS busier than ever with 95% of beds full (BBC, Dec 5, 2024)
The NHS in England is busier than it has ever been heading into winter, the country’s medical director is warning.
Prof Sir Stephen Powis said rising rates of flu and the vomiting bug norovirus were putting hospitals under huge strain.
Around 95% of beds are already occupied at the start of December – rates normally only seen in the depths of winter.
It is no wonder that people get the impression that the flu is the major problem. We have those people in this thread, too, even though they ought to know better.
You have to read a bit more of the BBC article before it becomes apparent that COVID-19 might have something to do with this calamity, and here it's still just one of those winter viruses even though C19 is an all-year-round virus unlike the flu, which more or less disappears in the summer:
"The extra cases of winter viruses, such as Covid, flu and RSV, mean many hospitals will fall into critical incidents given the relentless challenges we have faced all year round."
And a bit further down the page, it becomes apparent that COVID-19 is actually the major problem. But for some reason, we have to read about the flu again before we get to COVID-19:
The winter data - the first of the season - also showed the numbers in hospital with flu had reached nearly 1,100, four times higher than at this stage last year.
Nearly 1,400 beds were occupied byCovid patients and 750 by norovirus. Another 142 children were in hospital with RSV each day on average.
This is out of a total of 100,000 beds, but with 95,000 occupied there is very little wriggle room if these numbers continue to climb.
And why not tell us about the number of those children who are hospitalized with C19? Because that is another one of those desired pandemic delusions: that children are immune to C19, that they don't die, aren't hospitalized and don't get Long Covid.
By the way, X is full of tweets from Covid-conscious immunocompromised people who are wondering if they aren't better off staying away from hospitals because of the danger of nosomical infections.

This is what learning to live with the virus, pretending that it's over, looks like in real life.
I don't know why journalists sometimes try to hide the fact and at other times, like here, merely resort to making it less conspicuous.
Is it something they are told to do by their bosses? Are they ashamed?

Reality is that which, when you stop believing in it, doesn't go away.
The basic tool for the manipulation of reality is the manipulation of words.
 
What if everyone had masked up? Analysys of app data has an answer (Nature, Dec 5, 2024)
Modelling study based on almost 250,000 positive COVID-19 tests in the United Kingdom shows that universal masking could have cut transmission markedly.
(...)
If a population all wear FFP2/N95 masks, this reduces the effective reproduction number for COVID-19 transmission by a factor of approximately 9.

It was not unknown how hospitals could cope with the pandemic in the spring of 2020.
San Antonio hospital could have an answer to the PPE crisis - elastomeric masks (kens5, May 1, 2020)
I get: "Access denied", so I can't link directly to the article. I don't know if it's because I'm in Europe.
Link here: Jason (he/him/ia) Ko Jason täku ingoa on X
 
The cough that dare not say its name (at least not in headlines ...)
Cat in the Hat on X comments on the BBC article Flu cases make NHS busier than ever with 95% of beds full :
Riddle me this…Across England, there are nearly 1,100 FLU patients in hospital right now & suddenly flu is all over the news……but the number of COVID patients in hospital has not dipped below 1,100 ON A SINGLE DAY IN THE PAST YEAR! Yet COVID barely ever gets mentioned.
 
The Daily Mail may lose some of its anti-vaxxer readers on this one:
Alarming rise of 'super-fit' slim young people suffering heart attacks as experts reveal theories for the surge (Daily Mail online, Oct 3, 2024)
Heart attacks were once thought of as a disease of age - but worrying new data shows they are increasing in healthy young adults.
Roughly 0.3 percent of of Americans aged 18-44 had a heart attack in 2019 - but last year that rose to 0.5 percent, or one in 200.
While that may still seem like a relatively low number, it represents a 66 percent increase in cases in just four years, which doctors call 'alarming.'
(...)
Studies have shown that, once in the body, the virus can cause the heart to become inflamed, a condition known as myocarditis, leading to damage that makes it harder to pump blood around the body.
Over time, in extreme cases, this can damage the organ to the point it becomes too weak to adequately pump enough blood to the rest of your body, causing heart failure. (...) Cheng said people who have Covid multiple times also are at higher risk of heart problems.
I assume that all the cases mentioned in the article, maybe except for the one in 2019, have already become part of the antivaxxer Died Suddenly mythology.
However, it's not exactly news that C19 damages the heart - also in young people:
COVID-19 Surges Linked to Spike in Heart Attacks (Cedars Sinai, Oct 24, 2022)
Prior to the COVID-19 pandemic, heart attacks were the leading cause of death worldwide but were steadily on the decline. However, the new study—recently published in the peer-reviewed Journal of Medical Virology—shows that heart attack death rates took a sharp turn and increased for all age groups during the pandemic.
The spikes in heart attack deaths have tracked with surges of COVID-19 infection—even during the presumed less-severe Omicron phase of the pandemic. Furthermore, the data showed the increase was most significant among individuals ages 25-44, who are not usually considered at high risk for heart attack.
It's disappointing that Sedars Sinai wrote "during the pandemic," but they made up for it by writing, "during the presumed less-severe Omicron phase of the pandemic."

ETA: We knew it as early as April 2020:
Young people with coronavirus are dying from strokes (WaPo, April 25, 2020)
Doctors sound alarm about patients in their 30s and 40s left debilitated or dead. Some didn’t even know they were infected.
 
Last edited:
Nosocomial is the word of the season.
More of those nosocomial infections. Still in the UK, but it seems to be much the same in other places with insufficient ventilation and masking in hospitals:
Nosocomial resp infections in hosps should never be the most common type.
Some things in prevention are not happening!
Wales' data is a likely window to the NHS as a whole.
Dr Evonne T Curran NursD on X, Dec 9, 2024
If NHS Wales wishes to reduce the pressure of acute respiratory illness
on hospital bed capacity, it should focus on preventing nosocomial
infection...
Gwladwr on X, Dec 9, 2024
SARS-CoV-2: Nosocomial 181; Community 70
Influenza: Nosocomial 89; Community 87
There is actually no reason to assume that nosocomial infections are the most common type.
Hospitals just happen to be the places where more people are tested and registered.
Heart attack patient advised to get themselves to A&E (The Times, Dec 8, 2024)
With six of England’s ten ambulance trusts at risk of service failure, another winter of scandal and tragedy is upon us
People having a heart attack or a stroke are being asked to get themselves to hospital after dialling 999 in some parts of England, as surging sickness levels plunge the NHS into another winter crisis.
The West Midlands Ambulance Service, which declared itself under “severe pressure” last week, confirmed a change to the script used by its 999 call handlers to suggest patients make their own way to hospital during periods of high demand.
A leaked internal staff memo sent on November 29 explained the change was necessary due to the length of time patients were waiting.
(...)
Hospitals have seen record numbers of patients on their wards as cases of flu, Covid-19, norovirus and RSV (respiratory syncytial virus) infections have also spiked.
Damned if you do, and damned if you don't.

Notice that, just like the BBC, The Times also prefers to keep the cough that there not speak its name out of its headlines:
UK flu cases four times higher amid fear of NHS 'quad-demic' (The Times, Dec 5, 2024)
The health service is also under increasing pressure from Covid, norovirus and RSV, with uptake for vaccines falling behind
 
Last edited:
And still in the UK:
Cat in the Hat has made a very long thread about the UK COVID-19 Inquiry:
COVID INQUIRY: X Megathread
As module 3 of the @covidinquiryuk draws to a close,
I’ve been looking back at what we’ve learned about
how it all went so wrong with infection control guidance for hospitals.
This is a long thread, so please grab a cuppa & make yourself comfy…
The thread has 277.2k views so far, but it deserved many more.
 
Lawrence: Biden's legacy will be 'paying dividends' for decades to come (MSNBC, Dec 11, 2024 - 14:45 min.)
Biden (13:50-->): From the crisis we inherited, we not only beat the pandemic ...
Yeah, right! Keep telling yourself that. I doubt that any of the many fact checkers will comment on it.
However,
[10 Dec 2024] Opening Remarks from @DrTedros at WHO media briefing:
“We cannot talk about COVID in the past tense.
“It’s still with us, it still causes acute disease and Long COVID, and it still kills.
“The world might want to forget about COVID-19, but we cannot afford to.”
The Cat in the Hat on X, Dec 11, 2024
With a short video (1:02 min.) from Tedros Adhanom Ghebreyesus' opening remarks.
More in the thread.
 
If any of you doubted the previous post telling us that we can't talk about COVID in the past tense, it is now official:
The pandemic is a current event!
 
Back
Top Bottom