Choosing to dig yourself a deeper hole is never a good idea. Your more appropriate response should be of the form "oh, yes, lots of additional noise and error sources I hadn't considered. I see what you mean femr2"
For several years, I've been teaching courses that involve a semester project. The project changes every semester, but I often use some kind of signal processing project that requires students to write software for approximate scaling and matching of noisy images or audio. The techniques we use for still images are applicable to video, where the main difference is the added dimension of time. The problems femr2 has been exaggerating in his last few posts are similar to the problems we routinely solve for still images.
I meant that it's not like Excel where I can click and see the data. If you measure correlation by eyeball on a graph, that's fine. I trust math more than my eyeballs. But, as noted, it doesn't matter. PS - I found the data on your website, thanks. I might play with it some, but not today.
I mean exactly what I said. I think that any lack of correlation between X and Y is (probably mostly) error. I don't believe that the [on edit - corner of the ] building moved sideways without moving up or down. Or vice versa. Given that this is 2 dimensional, I suppose it's possible to appear this way due to perspective, but I'm not positive. (Also, for the very early motion data, if you chose a different time = 0, you'd have lines that started farther apart, and the correlation might not be as obvious to your eye.)
We're talking about some wobbling around less than 0.1 pixels as extracted from videotape, and your own guesstimate of error bands when posting this were "around the +/- 0.2 pixel mark." For sake of argument, I'll agree. None of the variances you note are greater than your margin of error. So, if you measure "my eyeball looking at this super-magnified chart," yeah. In terms of "how did the building move," I'm much less sure.
I'm not sure why you keep stressing that this is a three-year-old chart. You just posted it here. If it's been superseded by something else, then post that. It seems to be the same data we've been discussing here ad infinitum.
This is another reminder of why folks ask you the "purpose" for this analysis. You don't think it matters whether the visible right-hand corner of a building moved up and left or up and right? You can't see why that might be interesting? Surely, you are aware that high-rise buildings sway in the wind, sometimes several feet? Even if the oscillation was from the impact of debris or from the fire or something, the building swaying back and forth would be completely different behavior from the building jumping up and to the right. If it's the latter, I think you probably need another explanation for what the data variance shows, because it's probably not the actual building movement.
No idea where you're coming from with your reject 160s and replace with 168s suggestion, as there's a blatantly obvious inflexion in motion direction at the 160s mark.
And in many other places. Is there anything of substance that can be inferred from that particular inflexion?
At about the 168s mark, however, the horizontal vs. vertical correlation starts to disappear, and I consider that significant, as it means a change in the direction of motion perceived by the camera, therefore if that movement was building movement, as you seem to defend, and not an artifact, it changed its nature at that point.
Which makes them pretty useless, as you don't have a way to know how inaccurate they are. For all we know, the graphs could well have ±1500 ft/s² error bars. They all show the same rough shape, that's about it. Lacking an error analysis, you don't even know if it actually crossed g.
I meant that it's not like Excel where I can click and see the data. If you measure correlation by eyeball on a graph, that's fine. I trust math more than my eyeballs. But, as noted, it doesn't matter. PS - I found the data on your website, thanks. I might play with it some, but not today.
I'm quite transparent with data release. I don't release it all as there would be number overload resulting and extra years of "argument" about excel file presentation format, ...
God no. You could choose to quibble about motion prior to the 160s mark, but there's no excuse to quibble motion after that point, at all. It's easily visible.
I've provided justification for motion assertions from around the 60s mark.
If you choose to reject such, that's up to you.
I don't believe that the building moved sideways without moving up or down. Or vice versa.
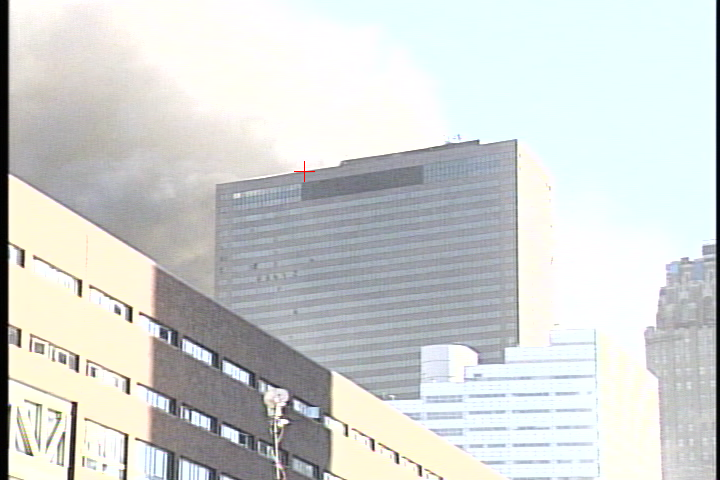
Who said otherwise ? What you may be "missing" is scale of motion. If you've even watched the video (cam#3) a few times (over the last 11 years) you can easily see the twisting flexure of the building. It's blatantly obvious.
How do you get to this point in discussion and seem to have no knowledge of the actual video imagery you are discussing ?
Given that this is 2 dimensional, I suppose it's possible to appear this way due to perspective, but I'm not positive.
Appear what way ? Early motion is primarily flexure (twisting) of the building.
Watch the video
(Also, for the very early motion data, if you chose a different time = 0, you'd have lines that started farther apart, and the correlation might not be as obvious to your eye.)
It doesn't work like that. The only difference would be potential shift of one component of roughly half the variance (which for cam#3 data is very low).
We're talking about some wobbling around less than 0.1 pixels as extracted from videotape, and your own guesstimate of error bands when posting this were "around the +/- 0.2 pixel mark."
Because you're asking about technical details from a graph I produced three years ago. Do you know what you did on 3rd November 2010 at 3pm in the afternoon ? Like I said, I'd need to check.
This is another reminder of why folks ask you the "purpose" for this analysis.
"This" analysis is identification of early motion. I don't care what direction it's in. I'm looking for motion vs no motion where behaviour changes (of a scale significant enough to indicate.... )
You don't think it matters whether the visible right-hand corner of a building moved up and left or up and right?
I can dig that information out for you if it is of interest to you, but for "this" purpose (identification of early motion) no, it's not interesting to me.
Surely, you are aware that high-rise buildings sway in the wind
What part of motion vs no motion is so difficult to understand ?
If it's the latter, I think you probably need another explanation for what the data variance shows, because it's probably not the actual building movement.
Trace data from a single viewpoint (with all of its error sources), or data from multiple viewpoints combined (with all of their combined error sources) ?
ROFL. What on earth makes you think I'm suggesting such error can be eliminated ?
That it can't is exactly my point.
A whole series of additional sources or error you hadn't bothered to consider (or were incapable of identifying)...some of which are in whole pixels...which does sub-pixel accurate relative motion data no good at all, innit
Exactly some of the reasons why I said...
"Combining trace data from two or more viewpoints, each with their own noise sources, each with limited knowledge of exact camera location, each with...you're just ADDING noise."
Any of this sinking in yet ?
And now you're distracting from your assertions about "technobabble".
By the process of combining multiple viewpoint trace data (taking account of the actual footage available)...do you end up reducing or increasing error ?
Exactly how were you going to deal with propogation of uncertainty ?
ROFL. Exactly where am I doing such ? Inventing your own arguments is really funny.
ROFL. Where am I deriding a particular technique ? What techniques of resolving three dimensional position from multiple viewpoint data have been mentioned in this recent discussion ?
Choosing to dig yourself a deeper hole is never a good idea. Your more appropriate response should be of the form "oh, yes, lots of additional noise and error sources I hadn't considered. I see what you mean femr2"
Trace data from a single viewpoint (with all of its error sources), or data from multiple viewpoints combined (with all of their combined error sources) ?
And do you point them to your discussions here ? I wouldn't if I were you. Not painting yourself in glory in the slightest. Reputation and respect car crash.
The problems femr2 has been exaggerating in his last few posts are similar to the problems we routinely solve for still images.
I'm quite transparent with data release. I don't release it all as there would be number overload resulting and extra years of "argument" about excel file presentation format, ...
God no. You could choose to quibble about motion prior to the 160s mark, but there's no excuse to quibble motion after that point, at all. It's easily visible.
My specific comments were directed at the graph which you labeled "cam 3 - bottom field - nw corner - lowpass." Nothing significant seems to have happened at ~160, other than it kinda looks like what happens at ~60.
Who said otherwise ? What you may be "missing" is scale of motion. If you've even watched the video (cam#3) a few times (over the last 11 years) you can easily see the twisting flexure of the building. It's blatantly obvious.
How do you get to this point in discussion and seem to have no knowledge of the actual video imagery you are discussing ?
Appear what way ? Early motion is primarily flexure (twisting) of the building.
It doesn't work like that. The only difference would be potential shift of one component of roughly half the variance (which for cam#3 data is very low).
I don't know what you mean by this. Having opened the data file, it looks like I have the wrong thing, and can't illustrate my point just now. Imagine if you started your graph "Cam 3 - very early motion - lowpass" at the 12 second mark instead of what you called t=zero. You might not have perceived the same correlation. The X and Y lines would not be on top of each other for as much as your graph shows.
The above says cam 3. What am I missing? Did you completely change the subject, and you didn't mean that the +/- 0.2 applied to the 2 graphs you posted to me in your response?
Because you're asking about technical details from a graph I produced three years ago. Do you know what you did on 3rd November 2010 at 3pm in the afternoon ? Like I said, I'd need to check.
I can't believe you haven't thought about this. Seriously, did the building wag back and forth, like all tall buildings do, or did it jump up and to the right? Not significant in your eyes?
"This" analysis is identification of early motion. I don't care what direction it's in. I'm looking for motion vs no motion where behaviour changes (of a scale significant enough to indicate.... )
I can dig that information out for you if it is of interest to you, but for "this" purpose (identification of early motion) no, it's not interesting to me.
I've been following this discussion for years. Once I finally stipulate (for sake of argument) that your data is accurate, and start asking about what the data actually show, you have no interest. I really don't know what to say. You think it's trivial whether a high-rise building in New York jumps up off the ground, rather than behaving like a normal building. Are these videos complete abstractions to you, or do they contain real-world events?
femr2, with all respect - my point was - It doesn't matter what the impulse was, if the building is simply waving back and forth like a normal high-rise, that's 180-degrees different thing from a building jumping up and to the right. It doesn't matter if the impulse was fire, debris, wind, or ninja turtles. One behavior is completely different from the other behavior. Perhaps I'm not explaining myself well, in which case I apologize.
I don't know. As above, it doesn't matter. Whatever such an impulse would be, it's hugely different from whatever would cause you to measure the building jumping up and to the right.
Just a note - as ever, this entire pointless derail of a conversation would have been avoided if, three years ago, you would have taken my advice and labelled your god damned graphs to a decent standard. "Horizontal motion" can be one of 2 directions. Which do your graphs show?
I did. If anything, this conversation has made me even more confused about your purpose for your analysis. You seem to have narrowed the entire conversation to "first there was no motion, then there was some motion, and then there was rapid motion." I'm not sure what the point of that would be. Please let me know, as I'd hate to have misunderstood you.
Then you clearly have not even inspected the source videos, cannot interpret the graphed data competently and by implication also reject NIST's WTC 7 motion analysis...
Would you like me to show you ? (as you have obviously not watched the cam#3 footage yourself)
My specific comments were directed at the graph which you labeled "cam 3 - bottom field - nw corner - lowpass." Nothing significant seems to have happened at ~160, other than it kinda looks like what happens at ~60.
Again, would you like me to show you, or perhaps you'd just waste less of my time if you watched the thing yourself ?
I don't know what you mean by this. Having opened the data file, it looks like I have the wrong thing, and can't illustrate my point just now. Imagine if you started your graph "Cam 3 - very early motion - lowpass" at the 12 second mark instead of what you called t=zero. You might not have perceived the same correlation. The X and Y lines would not be on top of each other for as much as your graph shows.
When ? (be specific please. some motion I cannot define in such terms, and not particularly interested. If you are, spend countless hours watching the clip(s) over and over again (probably in HuffYUV format to enable smooth scrubbing) zoomed in something like VirtualDub, so that you can gradually build a mental picture of the motion going on.)
I can't believe you haven't thought about this. Seriously, did the building wag back and forth, like all tall buildings do, or did it jump up and to the right? Not significant in your eyes?
LOL. For identification of early motion, I really don't care. If you want a basic understanding of the early motion it's twisting around the central core oscillating North and East to South and West (basically). If you ARE interested in such motion, at least work out what bleedin' video you're supposed to be looking at eh
To which I can only reply, again, wow. The purpose of your analysis continues to elude me.
ROFL. I just told you the purpose of "this" element of analysis...identification of early motion. It is sad that you are struggling to understand such simple assertions.
I've been following this discussion for years. Once I finally stipulate (for sake of argument) that your data is accurate, and start asking about what the data actually show, you have no interest.
Early motion is of great significance. YOUR particular points of interest, no. I really don't care what direction motion is in when what I;m looking for is the simple fact of there BEING motion.
Lest we forget, this element of discussion falls out from you asking me which direction the horizontal component of the early X trace data was in. I said I'd look it up for you as I produced the graph three YEARS ago.
Is there some behaviour you have identified whereby the direction of that horizontal component matters ? If not, stop wasting my time.
Just a note - as ever, this entire pointless derail of a conversation would have been avoided if, three years ago, you would have taken my advice and labelled your god damned graphs to a decent standard.
As I told you before your "rant", I'll check for you if it's so important to you (for whatever reason you haven;t explained yet). Until then, if "that's" what you're waffing on about, ...shhhhh
The part where your focus on "motion vs no motion" is so narrow, that it doesn't even matter whether the building moves left or right.
Why should it ? It's twisting and moves both "left" AND "right"...
If anything, this conversation has made me even more confused about your purpose for your analysis. You seem to have narrowed the entire conversation to "first there was no motion, then there was some motion, and then there was rapid motion." I'm not sure what the point of that would be. Please let me know, as I'd hate to have misunderstood you.
Before I get to the rest of this, there's just one thing I want to clarify. femr2, you are claiming that, on this video, you can "easily" see, with your naked eyes, the building twisting and flexing.
Is my characterization of your claim accurate?
femr2 said:
Is there some behaviour you have identified whereby the direction of that horizontal component matters ? If not, stop wasting my time.
Buildings all over the world are wagging back and forth in the wind. They are not jumping out of their footprints. I don't know how I could be more clear. Take a piece of notebook paper. Put it on a table. Rock it back and forth from left to right. This is a highly-magnified view of a normal high-rise building on any given day.
Before I get to the rest of this, there's just one thing I want to clarify. femr2, you are claiming that, on this video, you can "easily" see, with your naked eyes, the building twisting and flexing.
Bored of waiting for carlitos to say "er, yeah"...
The best way to see early motion by eye is to:
1) Download the NIST 1GB copy of the cam#3 footage, though carlitos YouTube link (in 480p) will suffice.
2) Download VirtualDub
3) Scrub back and forth through frames 5000 to 5400 paying attention to the NW corner. Zooming 200/300% won't hurt. (NIST T0 is frame 5398)
If you don't have a DV version, scrubbing will be jerky. Convert the video to DV or HuffYUV format beforehand.
Scrubbing through earlier portions of the video does reveal some motion, but it's much finer and more subtle, so zooming is a must...as is watching the video for a loooong time to let your poor brain adjust
Flexure of the building is clearly evident.
If you haven't bothered to get yourself a local copy of the video, here's two frames during that period...
Before I get to the rest of this, there's just one thing I want to clarify. femr2, you are claiming that, on this video, you can "easily" see, with your naked eyes, the building twisting and flexing.
Bored of waiting for carlitos to say "er, yeah"...
The best way to see early motion by eye is to:
1) Download the NIST 1GB copy of the cam#3 footage, though carlitos YouTube link (in 480p) will suffice.
2) Download VirtualDub
3) Scrub back and forth through frames 5000 to 5400 paying attention to the NW corner. Zooming 200/300% won't hurt. (NIST T0 is frame 5398)
If you don't have a DV version, scrubbing will be jerky. Convert the video to DV or HuffYUV format beforehand.
Scrubbing through earlier portions of the video does reveal some motion, but it's much finer and more subtle, so zooming is a must...as is watching the video for a loooong time to let your poor brain adjust
Flexure of the building is clearly evident.
If you haven't bothered to get yourself a local copy of the video, here's two frames during that period...
[qimg]http://femr2.ucoz.com/_ph/7/633033152.gif[/qimg]
...you may notice that the building moves !
I think that you and I have a different definition of:
easily
naked eye
My understanding of "can you see this with your eyes" doesn't involve downloading and installing a program, nor zooming, nor converting the video format, nor watching the video "for a loooong time to let my poor brain adjust." In general, I can either see something or I can't.
I'll get back to you over the weekend.
thx
ETA - Your throbby gif shows 2 "frames." Would those be what video laymen refer to as frames, or something unorthodox?
I'm using nothing but my naked eye to detect motion, easily. What are you using ?
What were you expecting ? The building doing a tap-dance off the frame ?
My understanding of "can you see this with your eyes" doesn't involve downloading and installing a program, nor zooming, nor converting the video format, nor watching the video "for a loooong time to let my poor brain adjust." In general, I can either see something or I can't.
I have the picture on a 24" LCD Monitor @ 1920x1200 AND Old age (ozeco41) requires 2 dioptre $AU19.00 glasses - Does that qualify for naked eye?
Fun aside the flexure of the building is obvious and it is post EPH collapse so something is clearly "starting to happen" or "getting a bit further along the track of happening". (I hope that covers me against pedantry.)
So from my simple engineer's perspective (ambiguity not originally intended but left in place) we have a collapse starting. (OK "or started...")
And it is a gradual build up to a "release" stage when sudden descent starts.
And that early motion seems to say something which could be important in the polarised "truthers v debunkers" debates.
And that "measurement tool" may have some errors in both noise and artefacts of technology. BUT I note that the other buildings are not moving. So femr'soops - achimspok's data is good enough for my purpose.
Meanwhile I've just mowed the lawn - record heavy rains over recent weeks but blue sky very evident today. Occasionally partly obscured by clouds.
If I play along with the parody:
1) Accuracy in absolute terms explained many times;
2) Whether it is good enough for any persons specific purpose depends on that purpose;
3) All measurements of this type have errors in two main areas viz "noise" and "artefacts of method";
4) So "what use it is" cannot be determined unless in the form of "what use for [a specified purpose]";
5) Noise in the source data is a problem;
6) However for your purpose of determining angelic activity within defined spatial boundaries the problem would seem to be more basic. It needs access to source material which does not appear to be in the public domain;
Why don't you forward your video of angelic dancing to femr for his comment as to feasibility and resulting estimates of accuracy?
I note it is to be "this pin". Do you have factory drawings? Together with the "as made" modifications?
Do you want the results to "sub-angel" precision?
Would "nearest whole angel" be "good enough"?
(If unsure you could ask him to "wing it")
Do you want measurements converted into metric or "imperial" units?
Step 1 - let femr have the video. BTW if you want to defray costs I can suggest a couple of organisations which may be interested in a Joint Venture. One has headquarters near Rome, the other in Canterbury, England.
This site uses cookies to help personalise content, tailor your experience and to keep you logged in if you register.
By continuing to use this site, you are consenting to our use of cookies.


....


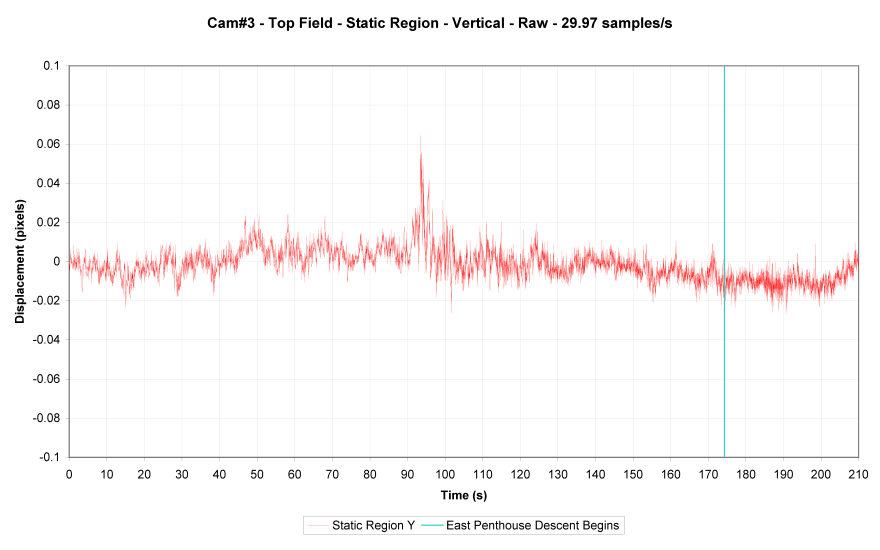
 (how many HOURS later ?