Richard Gage Blueprint for Truth Rebuttals on YouTube by Chris Mohr

Status
Not open for further replies.
its relevance to my original YouTube videos is that I made the claim that there MAY have been >g collapse rates at a few points along the NIST graph

Personally, I think what should be of more interest to you is the pre-release motion detected.

Early motion always raises (or should raise) the question for those suggesting an explosion->immediate descent...what caused early motion if descent was caused by an explosion.

I'd suggest much more pertinent for your personal intent.
 
....I think Ozeco may be suggesting that we are getting deeply into minutiae, losing the big-picture question, CD or not CD?
Not on this occasion Chris. Yes such is a regular concern of mine.

But the reason I suggested be clear about objectives is as a defence against those who possibly could attack on dubious grounds.

It is valid scientific research. And directly 9/11 related. However we still have people who attack femr2 if he posts material which is not explicitly about conspiracy - even though that nonsense was dealt with about a year back. Inconsistently those same people don't attack Oystein, Ivan K et al for "sciency but not conspiracy stuff" so we don't know.

And you seem to have given the imprimatur that it helps you so my second concern about "off topic": could be neutralised... :o


Even though I still think it is.... ;)
 
Personally, I think what should be of more interest to you is the pre-release motion detected.

Early motion always raises (or should raise) the question for those suggesting an explosion->immediate descent...what caused early motion if descent was caused by an explosion.

I'd suggest much more pertinent for your personal intent.

Why would early motion suggest an explosion and not a major internal collapse underway?
 
Why would early motion suggest an explosion and not a major internal collapse underway?

I think femr2 is pointing out that early motion is actually a problem for proponents of the theory that explosives caused "rapid onset of collapse" (ae911t vernacular) by "simultaneously removing all vertical supports" (common truther lore).


However, I like to point out that major internal collapse before release of north wall roof line would not of itself help much to differentiate between CD and fire-induced collapse. Youstill need a theory about why such major internal collapse occurred.

To prove explosive CD, you need to look for actual proof for the use of actual explosives. Such as: Many VERY loud BANGs; structural steel members showing failure modes consistent only with the destructive action of strong local shockwaves; or widespread chemical signature of used high explosives (noth thermXte).
Thanks, I misread the sentence.
 
I'd debate on what can be learned from the "post collapse" wobble.

:confused:

May I commend all three involved in this series of discussions.

I have been following with appreciation even though the topic is not one of my main areas of interest.

Plus it is at the limit of my scientific and mathematical comprehension - not something I can contribute to without a lot of revision of both fields.

A couple of comments which are not not criticisms:

1) You may want to consider explicitly stating "what is our objective?" It is probably of no importance in the amicable setting of your current your three way discussion but could be valuable if other members intrude with potential derails. And

2) The discussion is only tenuously linked to the thread tropic.

Good question.
My objective (I don't know about Oystein's or femr2's) was to find out more accurate periods of freefall acceleration in the WTC7 collapse and 1515 Flagler (which didn't show an initial FFA but showed similar bobbing up/down for 1-2 seconds before explosions and falling), or for other buildings CD, in order to compare periods of FFA and CD.

We know that for the WTC7 the displacement,time data contains a margin of error. There is no known engineering reason the NW corner should be bobbing up/down with regular frequency before the collapse of Column 79 and east penthouse. Therefore the 5 seconds before the EPH falls should be 0 displacement, 0 acceleration. This is the only "real" fixed data that could be used to adjust the subsequent data.

The wind was maximum 18 mph average with max gusts up to 32 mph.
http://www.wunderground.com/history...tml?req_city=NA&req_state=NA&req_statename=NA

Wind pressures were at 18mph ~ 1 psf, at 32 mph ~ 3 psf. Not significant and would cause horizontal not vertical displacement. One can get an idea of this force by driving at these speeds and sticking one's hand out the window.
https://courses.cit.cornell.edu/arch264/calculators/example2.4/index.html

1) There might be a means to more accurately adjust the post fall estimated acceleration line data to reflect the "real" 0 displacement before the fall of the EPH.
2) Perhaps the best we can do is to graph the post EPH data as a band instead of a line (Bollinger or other) within the "real" displacement data will lie.
3) The present acceleration line for WTC7 NW corner may be sufficiently accurate to conclude that the FFA and greater second stage/period is not proof that the initial first stage of < FFA NW corner fall was CDd. Which is where we are now.
4) Greater accuracy in the acceleration line is not necessary to determine that fire caused the collapse of WTC7.
 
Last edited:
My objective ... was to find out more accurate periods of freefall acceleration in the WTC7 collapse
It is unlikely that acceleration data more accurate than that I have presented will emerge, though it would be great if such did, of course.

and 1515 Flagler (which didn't show an initial FFA but showed similar bobbing up/down for 1-2 seconds before explosions and falling)
The 1515 Flagler trace presented also contained noise, and was a quick draft.

It really doesn't take much noise in the raw displacement data to cause visible artefacts in acceleration plots following two derivation processes on the data, of course.

or for other buildings CD, in order to compare periods of FFA and CD.
I may trace the recent descent in Glasgow.

We know that for the WTC7 the displacement,time data contains a margin of error.
Agreed.

There is no known engineering reason the NW corner should be bobbing up/down with regular frequency before the collapse of Column 79 and east penthouse.
See previous comments about early motion frequency and noise frequency.

Therefore the 5 seconds before the EPH falls should be 0 displacement, 0 acceleration. This is the only "real" fixed data that could be used to adjust the subsequent data.
Again, no, in many different ways.

The wind was maximum 18 mph average with max gusts up to 32 mph.
http://www.wunderground.com/history...tml?req_city=NA&req_state=NA&req_statename=NA

Wind pressures were at 18mph ~ 1 psf, at 32 mph ~ 3 psf. Not significant and would cause horizontal not vertical displacement.
Would need looking at in more detail, but I agree that quantifying expected wind response would allow clearer interpretation of early motion.

Note that the cam#3 data fidelity is much higher than the Dan Rather data fidelity and there is no doubt about the shape of early motion profiles from the former. Noise in the latter may mask some early motion.

There might be a means to more accurately adjust the post fall estimated acceleration line data to reflect the "real" 0 displacement before the fall of the EPH.
There may be ways of reducing noise, but it cannot be eliminated.
 
Last edited:
To chrismohr,

Thanks for posting your final video, number 18, which looks at the collapse of WTC7. You have asked for opinions about this so I’ll offer my input.
As a former architect myself, I will reveal that I do not believe the NIST NCSTAR 1A report and as much of your work here reflects what they have written this video is subject to the same criticisms which I levy to the NIST report on WTC7, a report which is based on pseudo science and distortions.
To focus more on the latter part of your video first I will start by looking at the symmetry of collapse, something that you do mention but you too distort to favour your own agenda. As is often the case with debunkers like yourself, you try to tie the collapse of the penthouse with any statements about the symmetry of destruction and clearly this is not fair or correct. What the ‘truth’ movement refers to when discussing the symmetry of collapse is the latter stage of the building’s failure when the main bulk of the building falls vertically to the ground. This is a clear and obvious stage and even NIST discusses this as being a distinct phase in the process of destruction referring to it as the ‘global collapse’. Therefore to suggest that the building’s failure was purely asymmetrical is wrong, especially when the evidence shows very clearly that after the fall of the penthouse, the remaining building, and that means most of it, fell straight down into its own footprint; not just the north wall, but at least three walls as seen in the available CBS and NBC videos. You need to be more honest here.
Also, contrary to your own interpretation of NIST’s report, you should make it clear to the viewer that NIST could not account for much of the physics in the latter stage claiming it to be uncertain, random and less precise. In fact they couldn’t even get their own models to fit very well as their simulations clearly show the outer walls starting to deform where as in practice they never did. Also, when describing the slight kink in the building compared with their own models NIST had to state that...., “the simulations do show the formation of the kink, but any subsequent movement of the building is beyond the reliability of the physics in the model”. Hmmm, doesn’t sound convincing to me and maybe not to many others either so why not come clean and mention this?
But what concerns me more is that NIST must have changed the parameters of its own computer simulation in order to get it to fit at all since they make the ridiculous assumption that steel buildings will effortlessly fall apart and return to their individual elements of I-sections and connectors when put under stress by gravity. This is simply not the case and perhaps this is why their own data is kept secret from public view. Buildings, especially steel ones, put up enormous resistance to being broken apart in such conditions because all those elements have been acting as a homogenous unit since construction and therefore never allow complete progressive collapse to occur. This makes your claim that WTC7 followed the ‘classic’ form of progressive destruction a gross distortion since no high-rise steel building has ever fully collapsed due to fire or damage prior to or since 9/11 making such comparison impossible. Again, you make it sound to the watcher that it is a common, everyday sort of event, when it is not.
I would put it to you that a more logical and probable reason for the outer walls remaining vertical and almost fully intact while the building fell is because the inner floors and columns were intact also. I could also draw a diagram like yours and show this and it would have as much validity as your example, in fact more so since it doesn’t rely on the many assumptions you make about buildings falling to pieces from the inside out or the north facade falling faster than free-fall due to a pivoting action! (which couldn’t have happen anyway since the east and west sides were intact too). I would argue that the simple fact the ‘global collapse’ occurred as it did; symmetrically, straight down at free-fall or near free-fall speed and with little or no deformation to the outer walls was because every supporting member of the lower floors had been removed of structural integrity at exactly the same time. Had this not happened, the bulk of the building would have rotated and toppled over or only partially collapsed, something which even NIST acknowledges. Only controlled demolition can cause such structural failure across the entire plan of such a massive building so quickly.
In short, I’m sorry to say that your video is an extremely lame rebuttal of the argument by Richard Gage and certainly does not put an end to the controlled demolition theory. By the way, steel I-sections do not snap like sticks.

Case closed.
 
Case closed.

Your saintly "architect" never does appear to get how an internal collapse can happen and leverage the exterior just as Chris states, nor how a "symmetrical" collapse takes out a building across the street, is dented in at the top during the collapse, and symetricalishness can be explained by the building exterior frame maintaining integrity as it falls. He gave up the ghost after posting his unsupported opinions and bailed out two days before Aug. 30th, the date you said he would be one of the few to not have his "head explode" for some reason.
 
Your saintly "architect" never does appear to get how an internal collapse can happen and leverage the exterior just as Chris states, nor how a "symmetrical" collapse takes out a building across the street, is dented in at the top during the collapse, and symetricalishness can be explained by the building exterior frame maintaining integrity as it falls. He gave up the ghost after posting his unsupported opinions and bailed out two days before Aug. 30th, the date you said he would be one of the few to not have his "head explode" for some reason.

Symmetricalishness. I like it.

Many people are in the same boat, not just him. Dr Bazant, too. David Benson, Ryan Mackey, they all made similar misrepresentations of the global mass flow.

These are just some examples of a much, much larger state of confusion and misrepresentation that still exists over a decade after the collapses.

Quite a lot of blame to go around.
 
Last edited:
I'm enjoying this back and forth, and its relevance to my original YouTube videos is that I made the claim that there MAY have been >g collapse rates at a few points along the NIST graph, or it may have been within the margin of error and not really exceeded g. Chris7 is not the only one who argues against that point; check out blogs around the 9/11 world and you'll find Jeremy Hammond and others also claim I am insane for even suggesting a >g possibility in the collapse. This long trialogue can show anyone that my assertion of possible >g is actually a likely scenario with better measuring devices, which makes my initial claim less insane sounding to anyone who visits all this.
This long trialogue is laughable pseudo science and will be rejected everywhere but here. You admit you don’t know much about structure yet you believe everything these anonymous double talkers say. Find someone willing to put his credentials on the line publicly. Please continue to make a fool of yourself on other forumn by repeating this >g and leverage garbage. Maybe you will come to realize that this is just an echo chamber of disinformation.

The whole >g thing is an attempt to deny that WTC 7 fell at FFA for about 100' and you know it.

FEMR's velocity curve on the NIST graph is first <g, then parallel to the FFA line at ~1.75 s [= g], then it is >g for ~0.5 s, then it stays right on the FFA line for ~1.5 s. [= g from 2.25 to 3.75]. Then it goes to <g again.


femr3.jpg


This graph greatly exaggerates the discrepancy and has 0.5 s of FFA.
http://img35.imageshack.us/img35/3263/femr4.jpg

You thought the interval between 2.75 s and 3.0 s was >g but that's not where FEMR has it. He has WTC 7 falling at g there. Those two data points are NOT WTC 7 falling at >g. The data dots are simply imperfect as even FEMR has said.

tfkffagraph.jpg


Your belief that WTC 7 was going from >g to <g to >g to <g again is shown to be wrong.
 
Last edited:
Sorry C7,

I would attribute the difference between femr's and NIST's measurements to femr's superior measuring methods. Both show occasional >g rates of collapse in slightly different points in time. And BTW each measure the fall from different points, which support my position that the descent "as a single unit" is only "as observed," not 100.0000000000% perfect. I am aware that the two sets of measurements don't dovetail perfectly. I also acknowledge in my video 18 and in my Skeptic.com article that this MAY be a margin-of-error issue as you claim. Or maybe not, which you deny.

It matters little; it just shows possible evidence that other forces besides gravity and structural resistance were at play during those 2.25 seconds. Your rigid denial of that possibility is the pot calling the kettle black.

I have charts from both NIST and femr showing the possibility of occasional >g. That's good enough for me to assert that maybe >g happened. I will not research further. I feel like an idiot asking experts about this 9/11 minutiae; when I do I get kicked off forums. NIST has stopped answering my (your) questions, which I consider a judicious use of taxpayer money. Kevin Ryan won't answer any more of my questions and now has taken to public ad hominem attacks against me. I've asked experts hundreds of times about hundreds of issues (not counting here at JREF) and am burned out.
 
This long trialogue is laughable pseudo science
There's really not much "science" involved, pseudo or otherwise. Simply accurate measurement, and some mathematics.

It's not rocket science.

Why dont you perform a trace yourself ? If you have any doubt about my data, generate your own.

You "accept" both Chandler's and NIST's, even though they are different :confused:

As you have seen, my data is similar, but you reject it because... ?

Just grab a video (cam#3 or Dan Rather), track the motion and plot it yourself.

and will be rejected everywhere but here
Nope. It took an awful long time for folk here to accept the increase in data accuracy. Others still reject it, or consider the differences irrelevant.

Have you contacted Chandler yet ? (You should request his data, y'know)

Do you know what software NIST used yet ?

Do you know what software Chandler used yet ?

Do you understand why even slight differences on a velocity plot become much larger when derived to acceleration yet ?

Do you understand that, by definition, my velocity and acceleration graphs "match up" ?

You admit you don’t know much about structure yet you believe everything these anonymous double talkers say.
Why do you "believe" NIST, or Chandler ? Do you have either set of data ? Do you understand how it was gathered ? Have you checked it by tracing the motion yiourself ?

Find someone willing to put his credentials on the line publicly.
lol. Who are you ? Who cares ?

Your issue is interpretation and ill-advised repitition of absolutes which are simply not true.

I'm talking about your "AT FFA" meme.

Yet again...


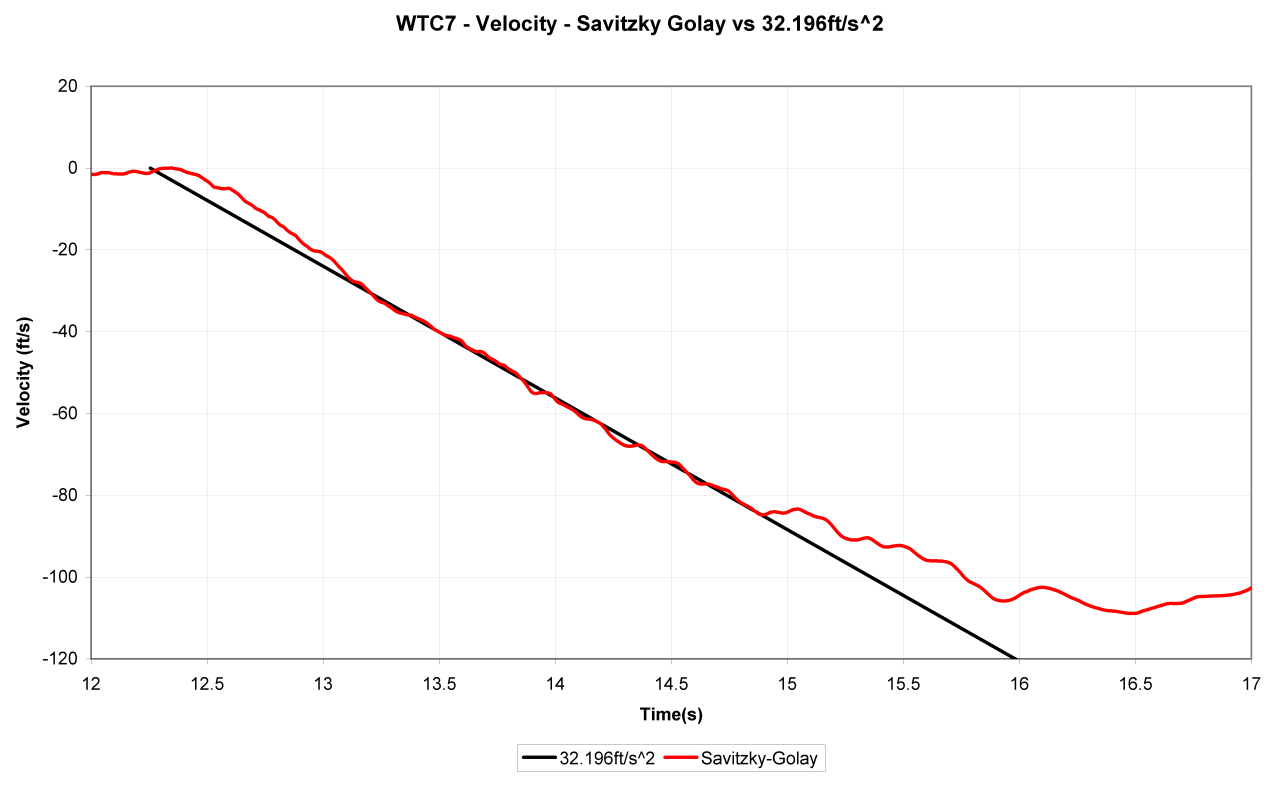
Do you understand that the black line is the NIST linear fit, their estimation of approximate and average acceleration during that period.

Remember...

NIST say their estimation of approximate and average acceleration is equivalent to the acceleration of gravity during that period.

Do you understand that even if noise error reduced the magnitude of the data that the trend, or shape, would not change that much ?

The whole >g thing is an attempt to deny that WTC 7 fell at FFA for about 100' and you know it.
You really don't seem to "get it".

Even on my data, the period you could call roughly freefall (which includes the period over-g) accounts for about 80ft of the descent.

Who is denying what, and where ?

The problem, and it's your problem, is that you have latched onto a "catchphrase" which is inaccurate and misleading. You need to change that.

FEMR's velocity curve on the NIST graph is first <g
Yep, though it would be better to be looking at the acceleration graph, wouldn't it.

then parallel to the FFA line at ~1.75 s [= g]
Nope. Not parallel. Now, tell me, what do you know about reading that velocity graph if a section of a curve has an average gradient greater than the one NIST plonked on there ?

then it is >g for ~0.5 s
Nope. About 1s. Again, use the acceleration graph. Much clearer. Same base data.

then it stays right on the FFA line for ~1.5 s. [= g from 2.25 to 3.75].
Nope. Pretty close, but also wobbling about a bit.

Then it goes to <g again.
Yaaay.

[qimg]http://img221.imageshack.us/img221/2116/femr3.jpg[/qimg]
Please don't upload copies of my graphs to other locations, as the quality is degraded. You're welcome to link directly to them.

This graph greatly exaggerates the discrepancy
What discrepancy ?

and has 0.5 s of FFA.
Bit more than that, and APPROXIMATE FFA, ffs.

Again, please link directly to my images rather than upload them to other locations.

You thought the interval between 2.75 s and 3.0 s was >g but that's not where FEMR has it. He has WTC 7 falling at g there. Those two data points are NOT WTC 7 falling at >g.
I don't have any sustained period AT "g".

The data dots are simply imperfect as even FEMR has said.
All data extracted from video contains some noise, absolutely.

That includes the data gathered by NIST and Chandler.

Everything derived from that data also contains some noise. It's not EXACT.

Sticking a straight line over a wobbly line does not magically make that straight line more accurate than the wobbly line. It just makes it straight, averaged, approximated, simpler.

Bored.

Your belief that WTC 7 was going from >g to <g to >g to <g again is shown to be wrong.
Not by you. You're simply showing continued inability to read and interpret simple graphs.
 
Last edited:
FEMR's velocity curve
It's about time you had a look at "femr2's velocity curve", with a line showing you 32.196 ft/s2...


Hold it !

Here's a link to a higher resolution copy...

Click.

7012px * 4960px


Now, AGAIN, whatever you say about the velocity data, remember, you are inherently talking about velocity data which, when derived, results in the "femr2" acceleration profile you've seen many times.

If you say something about acceleration, by looking at the velocity graph, that doesn't match up with what you can see on the acceleration graph itself...then you are...mistaken.


Oh, and before I forget to remind you/have a giggle...

Acceleration due to gravity varies depending upon where you are on the planet...

New York...

9.80200 m/s2 = 32.1587927 ft/s2

Would you Christmas-Eve it !

NIST's linear fit is all "OVER G". 32.196 > 32.159 :)
 
Last edited:
Sorry C7,

I would attribute the difference between femr's and NIST's measurements to femr's superior measuring methods. Both show occasional >g rates of collapse in slightly different points in time.
Your belief that the NIST data points show >g only demonstrates that you don't understand what you are looking at. The data points are not perfect as even FEMR has stated. For your >g to be valid, the building had to go from <g to >g to <g to >g. Even with the absurd "lever" theory, that would not happen.

And BTW each measure the fall from different points, which support my position that the descent "as a single unit" is only "as observed," not 100.0000000000% perfect. I am aware that the two sets of measurements don't dovetail perfectly. I also acknowledge in my video 18 and in my Skeptic.com article that this MAY be a margin-of-error issue as you claim. Or maybe not, which you deny.
This is how disinformation works. You create a doubt based on a false premise but give yourself wiggle room by saying "may" in the middle of several minutes of claiming that WTC 7 did not fall at FFA.

NIST realized that Chandler was right and repeated his analysis, getting the same result - ~100 feet of FFA. You refuse to accept their scientific analysis in favor of anonymous posters on a forum that rejects any evidence of controlled demolition and maliciously attacks anyone presenting it.

It matters little; it just shows possible evidence that other forces besides gravity and structural resistance were at play during those 2.25 seconds.
That is absolute BS. A system in free fall has no internal stresses. If the interior were to hit resistance it would slow the descent, not speed it up.

I have charts from both NIST and femr showing the possibility of occasional >g.
His graph shows only one period of >g.

That's good enough for me to assert that maybe >g happened.
Only because you want to deny FFA.

I will not research further. I feel like an idiot asking experts about this 9/11 minutiae
This is NOT minutiae and you know it. FFA for 100 feet proves CD and you know it.

when I do I get kicked off forums.
The first casualty of this phony "War on Terror" was our right to question the official conspiracy theory on most public forums and journals. "Homeland Security" was Hitlers excuse to shut down descent.

Off topic: Do you think we need 30,000 armed drones flying over U.S. cities to protect us from terrorists? Do you want to live in a police state?

NIST has stopped answering my (your) questions, which I consider a judicious use of taxpayer money.
Really?

Kevin Ryan won't answer any more of my questions and now has taken to public ad hominem attacks against me.
You have aligned your self with and become a spokesperson for a forum that denies all evidence that refutes the OCT and maliciously attacks anyone presenting it. You should expect the same in return. This is not subject for the faint of heart. There's a million people dead and counting, the Constitution has been trashed and we are rapidly becoming a police state, all because of the false flag event of 9/11.

I urge you to have a long heart to heart talk with Fran. She understands what you are going thru.
 
Last edited:
It's about time you had a look at "femr2's velocity curve", with a line showing you 32.196 ft/s2...
http://femr2.ucoz.com/_ph/7/2/135024800.jpg

NIST's linear fit is all "OVER G". 32.196 > 32.159
Higher resolution or more data points cannot change the rate of decent over 2.25 s.
NCSTAR 1A pg 45
This acceleration was 32.2 ft/s2 (9.81 m/s2),
equivalent to the acceleration of gravity g.

[within 1/10 of 1% of g in NYC - negligible - too small to be considered]
The acceleration of gravity for New York City is 9.802 m/s2
You are wrong.
Correction: You are right about the numbers but you are wrong about the entire FFA being >g. The difference is minute and well within the margin of error. Any scientist or reasonable person would not split hairs as you are doing by saying it was >g.

Your graph shows absolute FFA for ~0.6 s, then slightly >g for ~0.1 s, then ~FFA for ~1.8 s. Total: 2.5 s.

The slightest movement in the camera several miles away could account for the momentary >g reading.

You have confirmed FFA for ~1.5 seconds.

femr5e.jpg


These measurements are not exact so NIST included some qualifying words. Deniers will try to slither around FFA by noting the "wiggle words" like "approximately constant" and "estimation" and "negligible resistance" in a effort to obfuscate the fact that WTC 7 fell at FFA for ~100' as measured from two locations.
 
Correction: You are right about the numbers
Good start. Yes, I know.

but you are wrong about the entire FFA being >g
Oh dear. Short-lived progress.

Who said it was ? Reading comprehension fail.

The difference is minute
Correct.

and well within the margin of error.
Woo hoo. Progress again.

Margin of error. Approximation.

Any scientist or reasonable person would not split hairs as you are doing by saying it was >g.
It is "splitting hairs", absolutely. And funny as.

It is rather funny that your revered NIST linear fit is in fact >g :)

Yet you now choose to reference margin of error and pull it down to exactly "FFA" to suit your preference.

Transparent. Stupid.

Your graph shows absolute FFA
ROFL. Let me remind you again...

If you say something about acceleration, by looking at the velocity graph, that doesn't match up with what you can see on the acceleration graph itself...then you are...mistaken.

Here is the acceleration profile generated from the velocity data your are in fact talking about...


There is no period of absolute FFA anywhere within my data.

Approximate for a period, sure.

At the beginning of descent, absolutely not.

Learn to interpret graph data properly.

Stop using velocity plots to estimate approximate acceleration by badly performed linear fitting. You'll keep making an ass of yourself. You have the acceleration plot available. You have no excuse.

The slightest movement in the camera several miles away could account for the momentary >g reading.
There are many possible noise sources, including remnant camera motion. However, I extract camera motion from the data by tracing large regions of static areas, which provides even higher fidelity data than that possible from the NW corner, and enabling removal of most camera motion.

You also need to remember that NIST used the Cam#3 viewpoint, using a point on the roofline as their T0 candidate whose initial motion was primarily N<->S rather than vertical. Their data is taken with a much lower sample rate. Their data is likely traced by hand.

It's not very accurate. They should have done a better job of it imo, but they didn't bother.

You have confirmed FFA for ~1.5 seconds.
I like the "~".

Add one of those before your "FFA" and I'll be happier.

Repeat "exactly" or "absolute" there and you simply confirm stupidity, blatantly and deliberately.

These measurements are not exact so NIST included some qualifying words.
Correct.

NIST say their estimation of approximate and average acceleration is equivalent to the acceleration of gravity during that period.

I'm afraid that's you in this case.

will try to slither around FFA by noting the "wiggle words" like "approximately constant" and "estimation" and "negligible resistance" in a effort to obfuscate the fact that WTC 7 fell at FFA for ~100' as measured from two locations.
ROFL.

It seems you just can't help yourself, nor will you accept help offered.

Again, all you have to do is add a couple of tildes "~".

From my data, I have no issue with...

~FFA for ~1.75s, with >~0.5s of that being likely to be >g, during which the NW corner descends ~80ft.

Being more "precise" is not supported by the data.

Similarly, using the NIST data to state absolutes is also erronious.

You were asked a number of questions, all of which you've simply ignored. I assume due to lack of knowledge. I suggest you attempt to answer them. Doing so will actually help your understanding of what you are trying to talk about.

I don't think I'll waste any more time on you. You clearly have no interest in doing anything but impotently repeating the pointless meme you have tattooed upon your forehead.
 
Last edited:
Status
Not open for further replies.

Back
Top Bottom