Richard Gage Blueprint for Truth Rebuttals on YouTube by Chris Mohr

Status
Not open for further replies.
Yes. Cam#3. Not very suitable for performing derivation of velocity and acceleration from that viewpoint, but significantly higher accuracy and lower noise for raw displacement data extraction.

Which brings us (or BA) back to the question: What would make the NW corner bob up and down?
 
Which brings us (or BA) back to the question: What would make the NW corner bob up and down?
Depends whether the motion is vertical, or not.

Cam#3 traces show early motion both horizontally and vertically...from the viewing perspective in pixel units.

The actual motion is more likely N-S-E-W, not up-down.

Flexure/twisting of the building.

Am sure I've been through this recently...
 
You have no accurate way of knowing what occurred internally.


By all means apply "better math" to the data. I'd be more than curious to see the results.


Why do folk here have such short attention span/memory ?

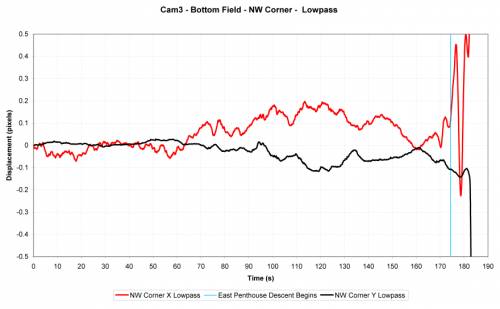
The NW corner was in motion long before release...


You quoted that image less than four HOURS ago.


Again, it's amplified noise. It can maybe be reduced slightly but it's not going away with data taken from the Dan Rather footage. As you can see above, noise levels in the Cam#3 data are much reduced.


I know of no way to extract higher fidelity data. The techniques were refined over a period of about 18 months. Anyone wanting to give it a whirl is more than welcome.


It is moving.

Use Cam#3 graphs if you're interested in displacement. Use Dan Rather graphs if you're interested in acceleration. Dan Rather data is noisier than Cam#3 data. Nothing to do with the data extraction method or data treatment, simply video quality. And, yes, I have the highest quality Dan Rather footage I can lay my hands on.

Here's a sample of the image data was extracted from:
346289729.gif


The source video was pre-stabilised with use of two static regions within SynthEyes, then pegged to be static around the NW corner.

There's negligible camera motion or rotation.

An (automated) trace is fairly impractical with that viewpoint.

Watch it a few times zoomed to get a clearer impression of the motion ocurring.

It sounds like you're sore someone suggests your charts can be improved by others.
Other people understand what I'm driving at.
I'm not going to ping-pong this thing with you until they're bored to tears.
 
Last edited:
Originally Posted by BasqueArch
The floor collapses occurred in the eastern portion at different times in bay sized portions, not the entire floor, and these measurements are from the NW corner on the opposite end of the building reducing the likelihood of this, but I can’t quantify it. From the acceleration curve and time I very roughly estimate at 6”-8” of net max-min bobbing. This figure can certainly be revised by better math. I doubt the staged floor collapses at the eastern end could have caused this magnitude of bobbing at the western corner, but I have no math for this.


Oystein. Right. I have no math as well, and would share your guess that the floor collapses wouldn't produce measurable (by a distant TV camera) displacement at the NW roof, just saying we can't rule this out a priori - without math or a similarly competent method

Kant would say it would have to be synthetic a posteriori. This can be determined, but not by us.

Originally Posted by BasqueArch
If the NW corner should not have moved for the last 5 seconds before the EPhouse collapse, then one could adjust this displacement,time data to produce a close to 0 acceleration for this 5 second period.

Oystein -Using what? Fourier analysis? You can mimick any function as closely as you like with those, but would not learn anything of substance about the nature of the random fluctuation. You'd simply pull the line flat, by forcing it to be so. You can get that result more simply: Just draw a straight line with ruler and pencil.
I know better than to proscribe what would yield the better results. Fourier analysis? Who knows?
Yes you can draw a straight line though the precollapse data with a ruler and pencil, but what line would you draw afterwards.

<snip>

I believe the question of whether the present acceleration line can be improved (in concept and assuming the first 5 seconds are near 0 for displacement and the time tracking is most accurate) can be answered by someone like WDClinger between beers.
 
Last edited:
Here's a sample of the image data was extracted from
Right video, but that's been processed, twice, for stabilisation, which is no good for tracing purposes. Sub-pixel information affected by stabilisation process.

It sounds like you're sore someone suggests your charts can be improved by others.
Not at all. I've certainly received criticism from a multitude of folk who haven't bothered to try, but anyone who wants to come up with even better data...absolutely fine by me.

Other people understand what I'm driving at.
I understand what you're saying, but unfortunately the reality is that higher fidelity raw data is unlikely, but welcome, and the processing steps afterwards are pretty good, but processes which result in better results are again very welcome...as long as said folk actually get their hands dirty and do it. All this data was extracted over a year ago, presented, and it's taken this long to, er, sink in.

I'm not going to ping-pong this thing with you until they're bored to tears.
"Calibrating to zero" isn't the way I'm afraid.

By all means apply other processes to the data, or better still, extract your own raw data and process that.

The Savitzky-Golay smoothing that is applied is pretty good...

The Savitzky–Golay smoothing filter is a filter that essentially performs a local polynomial regression (of degree k) on a series of values (of at least k+1 points which are treated as being equally spaced in the series) to determine the smoothed value for each point. The main advantage of this approach is that it tends to preserve features of the distribution such as relative maxima, minima and width, which are usually 'flattened' by other adjacent averaging techniques (like moving averages, for example).

It was suggested many moons ago that a "piece-wise" polynomial regression, in 1s chunks, was the best way to treat the data.

The SG method performs a polynomial regression at every sample...in 1/59.94s chunks.
 
I believe the question of whether the present acceleration line can be improved (in concept and assuming the first 5 seconds are near 0 for displacement and the time tracking is most accurate) can be answered by someone like WDClinger between beers.
Probably the easiest way is to use the Cam#3 data, but treat it for perspective before derivation.

The problem with that is that a full 3D motion analysis requires additional viewpoints which are not available/suitable.

Skewing due to non-vertical metion remaining in the trace data is likely to skew derived acceleration data more than the relatively low noise level in the Dan Rather data.
 
Depends whether the motion is vertical, or not.

Cam#3 traces show early motion both horizontally and vertically...from the viewing perspective in pixel units.

The actual motion is more likely N-S-E-W, not up-down.

Flexure/twisting of the building.

Am sure I've been through this recently...

Not up-down? :confused: You said earlier, when we were discussing vertical movement as seen from the Dan Rather perspective, that the NW corner was in motion. I took that as meaning that it was moving vertically, I.e. that it would have been visible if video resolution were good enough and margin of error small enough. If motion was exclusively horizontal ("N-S-E-W, not up-down"), then there is NO "real motion" in the Dan Rather video.


I did notcie the word "likely" in "more likely N-S-E-W, not up-down" ;)


BA, do you think it more plausible that the NW corner would exhibit lateral movent in the early stages of collapse, pre-release? The kinetic energy for lateral movement must come from somewhere, most likely potential energy, i.e. something moving down for good, but that something doesn't have to be at or near the NW corner.
 
It sounds like you're sore someone suggests your charts can be improved by others.Other people understand what I'm driving at.
I'm not going to ping-pong this thing with you until they're bored to tears.

Frankly, that's not my impression, quite the opposite ;)
 
Last edited:
Kant would say it would have to be synthetic a posteriori. This can be determined, but not by us.
I don't like Kant, but - right ;)

I know better than to proscribe what would yield the better results. Fourier analysis? Who knows?
It is possible that someone has a better idea, but I think my mathematical bone has sufficient intuition to assign a low probability to it. Fourier analysis is the standard generic method to find approximate functions when you have no theory that is best described by other function types. In this case, I would think the real motion is some complex interaction of elastic "swinging" - stuff that might indeed be modelled with trigonometric functions (sinus curves), and so I see some a priori justification why Fourier transformation would even be a good for engineering reasons.

[ETA] On second thoughts, the random sampling noise of course has no reason to conform to any specific type of function such as Furier transformations. I misrepresented up the cause for (possible) signal as the causes of noise in the above paragraph :boxedin: [/ETA]

Yes you can draw a straight line though the precollapse data with a ruler and pencil, but what line would you draw afterwards.
Exactly! That's really my point: You can do whatever you want with the pre-collapse wobble, but you won't learn from this what to do with the post-collapse wobbles.

I believe the question of whether the present acceleration line can be improved (in concept and assuming the first 5 seconds are near 0 for displacement and the time tracking is most accurate) can be answered by someone like WDClinger between beers.
I am sure WDC is better at this than I am ;)
 
Last edited:
I'd debate on what can be learned from the "post collapse" wobble.

:confused:

Nothing. The same +/- 3 ft/s2*) wobble are random noise pre- and post-collapse and thus do not conform to any function with explanatory or predictive power.


*) ...or thereabouts, and assuming that second derivative of S-G-smoothed noisy data yields a meaningful measure of margin of error
 
Last edited:
You said earlier, when we were discussing vertical movement as seen from the Dan Rather perspective, that the NW corner was in motion.
Yes.

I took that as meaning that it was moving vertically, I.e. that it would have been visible if video resolution were good enough and margin of error small enough.
Who knows ? Perhaps if noise levels were lower, then some motion would be attributable in the vertical direction. However, it certainly wouldn't be at the kind of frequency in the graphs presented, and would require low-pass-type filtering...which would totally mess up the data'a use for derived velocity and acceleration.

If motion was exclusively horizontal ("N-S-E-W, not up-down"), then there is NO "real motion" in the Dan Rather video.
You mean early motion I assume.

Who knows. Perhaps there is some, and it's swamped by noise.

I'd suggest frequency of motion is similar to that detectable with cam#3 footage though. An important point. 100s for half an "oscillation?".

I did notcie the word "likely" in "more likely N-S-E-W, not up-down" ;)
Cool.

BA, do you think it more plausible that the NW corner would exhibit lateral movent in the early stages of collapse, pre-release? The kinetic energy for lateral movement must come from somewhere, most likely potential energy, i.e. something moving down for good, but that something doesn't have to be at or near the NW corner.
Certainly seems to be in motion, though the cause has not been "nailed". Some could be wind, which would not gel well with your suggestion. I suggested here not long ago (to you iirc) that my view is that at least the final phase of motion (from 60s to 160s on the early motion graph) is related to events shortly afterwards, and possibly enabled by destruction of column 21.
 
n this case, I would think the real motion is some complex interaction of elastic "swinging" - stuff that might indeed be modelled with trigonometric functions (sinus curves), and so I see some a priori justification why Fourier transformation would even be a good for engineering reasons.
Low-pass filtering has proven effective, but see earlier caveats.
 
Last edited:
...
Who knows ? Perhaps if noise levels were lower, then some motion would be attributable in the vertical direction. However, it certainly wouldn't be at the kind of frequency in the graphs presented, and would require low-pass-type filtering...which would totally mess up the data'a use for derived velocity and acceleration.
Understood.

You mean early motion I assume.
Yes.

Who knows. Perhaps there is some, and it's swamped by noise.
Ok, yes, of course, we can't know this for sure.
So to summarize: there was early motion of the NW corner, but it's swamped out in the Dan Rather video so we can't know if it had a vertical component; from Cam 3 it seems like that movement was mostly lateral. Right?

I'd suggest frequency of motion is similar to that detectable with cam#3 footage though. An important point. 100s for half an "oscillation?".
Hmmm don't know, doesn't have to be the same, the lateral elastric response of the steel lattice can certainly have a frequency quite different from a vertical response.

Certainly seems to be in motion, though the cause has not been "nailed". Some could be wind, which would not gel well with your suggestion. I suggested here not long ago (to you iirc) that my view is that at least the final phase of motion (from 60s to 160s on the early motion graph) is related to events shortly afterwards, and possibly enabled by destruction of column 21.
Correct, I had this dimly in the back of my mind. The problem that you don't have any good enought footage from much (hours perhaps) earlier to get a feel for normal movement caused by wind.


I guess I have understood the NW corner movement in sufficient detail now for my desired level of understanding. I'llk drop to the background now and see if anyone gets something out of it.

Thanks fpr your patience.
 
So to summarize: there was early motion of the NW corner, but it's swamped out in the Dan Rather video so we can't know if it had a vertical component;
Yes, without additional noise elimination technique I've not tried on that dataset.

from Cam 3 it seems like that movement was mostly lateral. Right?
Motion is detectable in both horizontal and vertical directions, in pixel units.

As the cam#3 viewpoint is not orthogonal, the period of motion is long (100s) and the structural requirements for motion to be vertical, it is suggested that the motion is primarily lateral flexure/twisting. (And that the cam#3 data can therefore be a bit misleading about true direction of motion)

Scrubbing through video tends to support this suggestion (and it would make common sense)

Hmmm don't know, doesn't have to be the same, the lateral elastric response of the steel lattice can certainly have a frequency quite different from a vertical response.
Cam#3 viewpoint is not THAT different. There's still the ability to detect vertical motion (NIST used it for their primary descent metrics) so trace data from cam#3 should contain vertical motion AS WELL AS be polluted in the vertical direction by some motion which is not...the biggest factor there is, as the NIST "kink" blunder teaches...being careful to interpret direction of motion as best y'can.

Any actual vertical motion in the Dan Rather early motion data should certainly be present in the Cam#3 data (unless by some freak of nature it's cancelled out by very very specific lateral motion, but...nah)

Correct, I had this dimly in the back of my mind. The problem that you don't have any good enought footage from much (hours perhaps) earlier to get a feel for normal movement caused by wind.
True, though the significant increase in magnitude AND the extremely rapid inflexion of direction at the 60s mark would tend to preclude wind.
 
Last edited:
May I commend all three involved in this series of discussions.

I have been following with appreciation even though the topic is not one of my main areas of interest.

Plus it is at the limit of my scientific and mathematical comprehension - not something I can contribute to without a lot of revision of both fields.

A couple of comments which are not not criticisms:

1) You may want to consider explicitly stating "what is our objective?" It is probably of no importance in the amicable setting of your current your three way discussion but could be valuable if other members intrude with potential derails. And

2) The discussion is only tenuously linked to the thread tropic.
 
Who knows ? Perhaps if noise levels were lower, then some motion would be attributable in the vertical direction. However, it certainly wouldn't be at the kind of frequency in the graphs presented, and would require low-pass-type filtering...which would totally mess up the data'a use for derived velocity and acceleration.
I'm thinking a sort of bandstop filter might be useful. Measure the frequencies/amplitudes of the noise in a section assumed to be static, then attenuate the same frequencies in the whole graph by about these amplitudes. It destroys data too, but at least it could respect other frequencies, and even part of these, if they are attenuated by these amounts instead of eliminated.

I don't have the tools to try it though; I only have two possibilities. The only program I have available for Fourier analysis and filtering is Audacity; the idea would be to convert the trace data to a 16-bit audio-like signal and process it like that. The second is making my own program. The first feels like it wouldn't work very well and would be imprecise. For the second, my ratio motivation/estimated effort doesn't pass the threshold.

Question... In this graph:

666377698.jpg

Which are the sign conventions for the red line? I could check NIST's moiré chapter but I feel lazy :blush:
 
I'm thinking a sort of bandstop filter might be useful.
It's only really the high frequency changes that need filtering out.

Applied a FFT based lowpass filter (0.5Hz Cutoff frequency) to the resultant acceleration data...


It does appear to change slightly at ~6s prior to release.

Applying the filter earlier in the chain (at velocity or displacement data level) may provide additional clarity, but it will certainly mess with the acceleration data.
 
May I commend all three involved in this series of discussions.

I have been following with appreciation even though the topic is not one of my main areas of interest.

Plus it is at the limit of my scientific and mathematical comprehension - not something I can contribute to without a lot of revision of both fields.

A couple of comments which are not not criticisms:

1) You may want to consider explicitly stating "what is our objective?" It is probably of no importance in the amicable setting of your current your three way discussion but could be valuable if other members intrude with potential derails. And

2) The discussion is only tenuously linked to the thread tropic.
I'm enjoying this back and forth, and its relevance to my original YouTube videos is that I made the claim that there MAY have been >g collapse rates at a few points along the NIST graph, or it may have been within the margin of error and not really exceeded g. Chris7 is not the only one who argues against that point; check out blogs around the 9/11 world and you'll find Jeremy Hammond and others also claim I am insane for even suggesting a >g possibility in the collapse. This long trialogue can show anyone that my assertion of possible >g is actually a likely scenario with better measuring devices, which makes my initial claim less insane sounding to anyone who visits all this.

Beyond that, I have little to add as I have nowhere near the technical expertise needed to be able to provide meaningful input. I think Ozeco may be suggesting that we are getting deeply into minutiae, losing the big-picture question, CD or not CD?
 
Status
Not open for further replies.

Back
Top Bottom