Merged Silver Over 40.00 / Real and fake prices

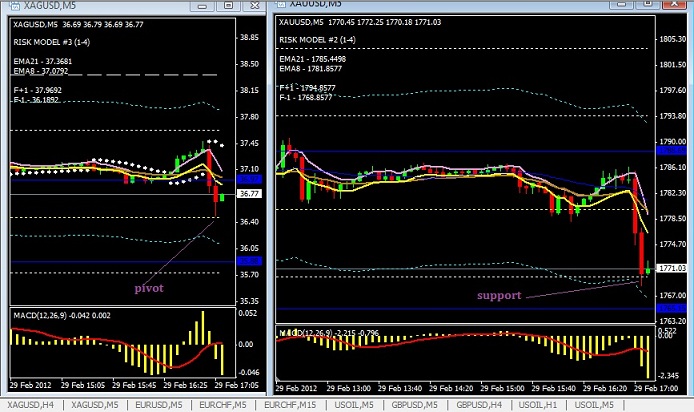
Ok so as an example, silver and gold just had a minor sell off now following some news or Bernanke or something, look at where they stopped and reversed, pivot for Silver and S1 for Gold.
178524f4e41b7b8e10.jpg


edit, only fair to note that in what just into a proper bear raid gold just plunged straight through S1, S2 & S3 and would have properly taken my stops out had I gotten round to putting the buy limits in yet.

..lucky..
 
Last edited:
Last I checked, silver was $34.68.

Did anything, anything in all this "resistance level" talk predict this move?

Anything, anything in the charts?

After the fact rationalizations are easy. The proof of the pudding is meaningful predictions. Those seem hit and miss at best.
 
nope, nothing on my level of analysis anyway.. :)

it was when S1 failed at 1770 (gold) it dropped $50 in a straight line in 2 minutes

but then pretty much everything got sold off today on central banker activity (what else?) and gold, savagely so.

but these are hardly normal markets we have any more, are they? hanging on every CB's word wondering where the next trillion in emergency liquidity is coming from and throwing a paddy at the mere suggestion it may not be imminent.
 
Last edited:
Did it pop today? BBC shows Silver dropped 7.2%

yesterday was quite brutal, gold was more significant than silver really.

silver at 34.9x again now, we're back to levels not seen since, uh last week :)
 
Since I guess resistance is futile, maybe I did mean support.

Its hard to keep them separate in my mind since I assume they're both imaginary!
 
Since I guess resistance is futile, maybe I did mean support.

Its hard to keep them separate in my mind since I assume they're both imaginary!

lol. why do you find it so hard to visualize that there are points where heavy buyers wait with order in place that would stop all but the biggest sellers?

if you look here for example you can see it live (across the LBMA during market hours) http://bullionvault.com/gold_market.do (select "Market Depth")

and silver def still doing ok YTD

fut_image.ashx
 
Last edited:
why do you find it so hard to visualize that there are points where heavy buyers wait with order in place that would stop all but the biggest sellers?

I have a normal (relatively) human brain. So I find it relatively easy to viualize all kinds of things that just are not so.

Patterns in charts and past performance predicting the future and support levels and resistance and slopes and head-and-shoulder formations and computer programs to pick winners all seem feasible. It all sound so good.

But reasoning and skepticism leads me elsewhere.

Let's say everyone agrees that there's support or resistance or something otherwise "special" about $35 silver. Not everyone does, of course, and in an efficient market buyers will equal sellers at that price. But let's say everything points to silver being a "buy" when it hits $35. Someone, somewhere will try to jump the gun and buy it at $34.99. Or $34.98. Or whatever - if its on the way up. Or sell at $35.01 for that extra penny if its on the way down. I think any scheme will get evened out over time in this manner.

Maybe the madness of crowds does superimpose itself on otherwise random, or at least unpredictable, price swings. Maybe its possible to sniff out inefficiencies in the market and make a little here and a little there. Some manage it, and some don't - which would also be the case if it was all mostly random.

I just don't feel TA or charts are the way to consistently make money in the market. But if it works for you, great!

And I may be entirely wrong. It wouldn't be the first time!
 
Last edited:
I'm having difficulty keeping track of the current state of predictions. Silver (so far) has not closed at over $37.50 so I suppose that Turk's $75 in 3 months prediction has not yet been triggered and yet from the article linked by kevsta on 28 February:

James Turk continues:

“In this regard, I have mentioned several times my expectation that once resistance at $35 is taken out, silver will climb to $68-$70 in 2 to 3 months. I still expect that outcome, but of course, only time will tell. I thought it might be tough going for silver in the $35-$36 area, but maybe not based on the strength we are seeing today.

Silver was above $35 for a few days, did that signal that resistance at $35 had been taken out or has its subsequent slight falls below that level shown that there is indeed resistance at that price level?

If Turk's "once resistance at $35 is taken out" means once the price of silver has risen above $35, never to look back then how will we ever know when that has happened ?
 
I'm having difficulty keeping track of the current state of predictions. Silver (so far) has not closed at over $37.50 so I suppose that Turk's $75 in 3 months prediction has not yet been triggered and yet from the article linked by kevsta on 28 February:

Silver was above $35 for a few days, did that signal that resistance at $35 had been taken out or has its subsequent slight falls below that level shown that there is indeed resistance at that price level?

If Turk's "once resistance at $35 is taken out" means once the price of silver has risen above $35, never to look back then how will we ever know when that has happened ?

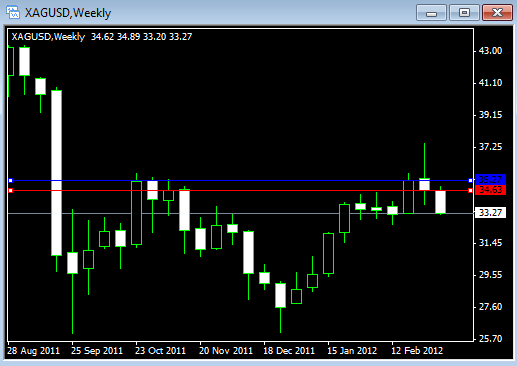
in general it's usually weekly closing prices that signify whether something is classed as "taken out" or not, I always assume that what they mean.

most of the really big money investors trade from weekly or even monthly charts, and those are the ones that always seem to get "special attention" from sellers to try and paint tops or close red, intraday spikes dont really register on those except as brief spikes.

178524f55e3081f596.png


when we close significantly above the level and dont immediately drop through it the next week you can say resistance was taken out, currently we just bounced off it
 
Last edited:
when we close significantly above the level and dont immediately drop through it the next week you can say resistance was taken out, currently we just bounced off it

That sounds like a reasonable definition. In that context what do you consider significantly above ?
 
in general...

...and...

I always assume...

...and...

...most of the really big money investors...

...and...

...except as brief spikes.

I went ahead and bolded what stand out to me as "weasel words*" and set-ups for later special pleadings. Technical Analysts seem to love that stuff when things don't go as predicted. Which is almost exactly half of the time, in my experience.


*nothing personal. I am NOT calling you a weasel!
 
That sounds like a reasonable definition. In that context what do you consider significantly above ?

well, resistance (or support) isn't an exact $0.01 line, it's usually a band of unknown thickness, but you can tell when you break through because there's nearly always an explosive move, like a dam letting go and the water rushing out, so once significant resistance (in either direction) is overcome you'll *usually* be a meaningful distance past that level anyway, and the level then tends to become resistance (or support) from the other direction.

its difficult to give figures, it would be easier to say that the price retests those levels from above and successfully bounces off and stays above.

at that point it generally needs something event driven (eg CB interventions, either verbal or market, major events) etc to break it again.

Technical Analysts seem to love that stuff when things don't go as predicted. Which is almost exactly half of the time, in my experience.

lol. very little is certain in this world, and this is even less so ;)
 
I routinely read (well, actually I don't because I don't look at it routinely, but whenever I do) technical comments like "A move above 92.30 is required to open up the way for a test of the key 93.0 level."

I laud the lack of weaselness on the part of such analysis in completely ruling out the possibility that 93.0 could be "tested" without the market first going above 92.3.

Here's someone's daily tech comment for ZNM2 (June 2012 expiry 10Y UST Globex future): Darned if I know what it means :D

June Tens: Choppy range action continues with Mon’s 131.09 bearish reversal day. Follows last week’s failure near the 131.21 Jan-Feb internal trendline (green) and drop to the 130.10 Feb 3-Feb 28 .618 swing objective/Jan 23 uptrendline (now 130.135). The repeated whipsaws within the broader range and mixed momentum signals do little to inspire confidence in a directional view. Breaks below the 130.03 Feb 21 low would open the door for a retest of interim range support near 129.16. Alternately, June Tens saw a 132.05 peak
 
Here's someone's daily tech comment for ZNM2 (June 2012 expiry 10Y UST Globex future): Darned if I know what it means :D

lol, thats easy, it means;

"it could go up, it could go down, we don't know" :)

do you trade Francesca yourself, or manage traders?
 

ISF - Join now!

Every member here is approved by hand. No bots, no spam, just people who care about evidence and honest debate.

Membership is free!

Create your free account

Back
Top Bottom