Merged Discussion of femr's video data analysis

Few people are even aware that this motion exists.

I don't know the full history of its "discovery" and how it has been published since.

I am aware that a lot of detailed work can be found in the911forum. That is, at least today, a rather obscure place.

I have asked some truthers if they are aware of researchers calling themselves "femrs" and "Major_Tom" and their work in tracking motion, and got mostly blank stares, so to say.

When I tried to link them to good a good starting point, I found none. As I have tried to explain to you, you "book" is not such a good starting point. It is a rather convoluted mess, full of arrogant self-aggrandization, and the information I am seeking is pretty well hidden there.

I think to reach serious audiences, a short series of papers, augmented perhaps by equally short videos, would be a good start.

Then reach out to the places where both sides sit.
Yes, I realize that many JREF posters have their blinders on and their own blind spots. That includes myself. That includes, you, too, of course.
Yes, I realize that many Truther sites are committed to heavy handed censorship and will block you as soon as you appear to be taking a kick at their pet theories.
So I realize it is hard to penetrate those walls.

But - have you even tried?

I think the first step - presenting the data and the arguments that rest on it in a clean, consise, rather formal format might do wonders. Even submit them to the editors of the Journal of 9/11 Studies - if you don't want to go to JEM or other real structural engineering journals directly. I know you are trying with your book, but I think you are at thes same time failing, by piling too much opinion and pop-psy stuff on top of it.
 
The early WTC1 movements of the upper NW corner and the antenna are described in detail at these links:

Upper West Wall Pulls Inward 9.5s before Collapse

Antenna Base Shifts Eastward 9.5s before Collapse


This information was presented in this forum in early 2010(?). Posters at that time apparently couldn't understand what mappings of building movement had to do with discussion of 9/11/01 or the WTC towers and had the threads removed from this subforum.


Points tracked by Femr2:

365389893.jpg


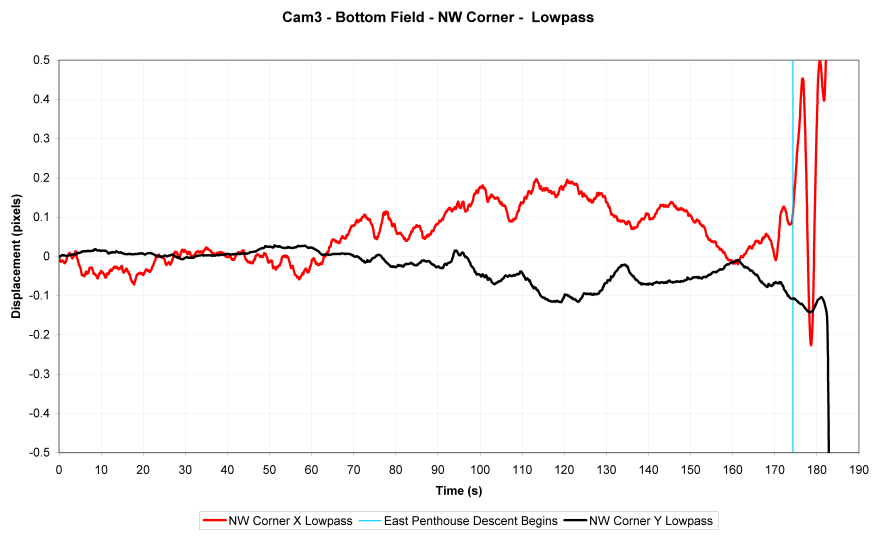
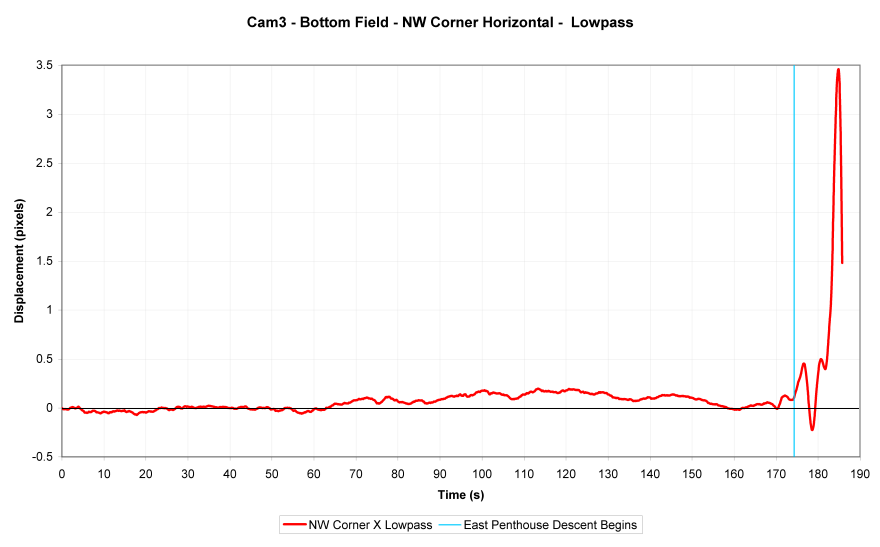
HORIZONTAL DISPLACEMENT, NW CORNER

238393243.jpg

http://femr2.ucoz.com/photo/6-0-426-3

Camera shake is obvious (between frames 1150-1250).

Black thick line is horizontal movement of the NW corner.

Grey is raw NW corner.

Blue is static point.

(Remember there would be a time delay between event and camera if indeed the source of shaking originated from WTC1)


Tracked points by achimspok of NW corner and antenna:

xcomponentstatic1.png

Larger version here


..................


These movements must be seen as only a part of a larger mapping of early movement consisting of 9 distinct indentifiable events. Features of the initial failure sequence can be understood as a rapid succession of 9 identifiable events occurring in the following order:


1) Deformations: Inward bowing of the south face
2) Earliest detectable creep movement of the antenna and northwest corner
3) Appearance of ~87th fl S face ejections
4) Appearance of 95th fl W face ejection
5) Visible downward movement begins: Columns fail over tilt of less than 1 degree, appearance of 98th fl ejections
6) Appearance of 77th fl W face ejections
7) Splitting of all perimeter walls: All visible upper parts fall out and over lower parts
8) Southward sliding of upper portion
9 ) Dis-integration of upper portion

Detailed summary of these 9 events available at this link:

....2.3: WTC1 Accurate Collapse History


All claims are verifiable and all methods are reproducible.

Note that visible movement does not begin until item #5.
 
Last edited:
I have read this thread many times. The point is, how does the world and building safety actually benefit from this? That was the purpose of this investigation after all.

Unless it's shown that these fine details actually effect the main thrust of the findings they are just that, fine details.

I have no problem with your work. Outside of just a hobby though, I see little actual utility for this level of detail.

The purposes of investigations into the WTC collapses are clearly stated by the NIST in their own wording in their executive summary and in congressional hearings in 2002 and 2005.

The reliance of the NIST on the visual record is stated very clearly in NCSTAR 1-6 section 9.2.

The reports, the executive summary and congressional testimony are excellent resources for those who want to know what the purpose of these investigations actually were. All this information is summarized in a condensed version at these 2 links:

....3.1: Purpose of the NIST Reports
....3.5: Reviewing the Purpose of NIST and FEMA Reports


Note that the NIST was reliant on the same visual record that is used by Femr2. This is explained clearly in NCSTAR 1-6 section 9.2, which is reproduced in the first of the above links.
 
Last edited:
Thanks.

One suggestion: To make it easier for 3D-challenged readers like myself to follow directions, could you add some explanations to the beginning of that text where the camera is (north of the north tower, I presume? But where? How far? How high? If that is known), and what we are looking at ("the north face of the tower. Ease side is on the left, west on the right, south face is hidden from view").
 
Note how the recorded movements and the corresponding mappings are considered a type of "porn" for carlitos.

People have all kinds of kinks. I just saw a documentary on people with love for inanimate objects that features a woman who is "married" to the Berlin Wall. As I said on the other thread, it would offend me less if there weren't people dying in the collapse gifs being fetishized.

Consider the following visual tool: Two frames are alternately flashed in an animated gif to show how different regions of the building are moving relative to each other and relative to static points..

In this first example, we look from the Sauret projection at the whole building above floor 92, flashing between frames 120 and 220 (just over 1.5 sec interval). Remember that the NW corner starts to accelerate downwards around frame 224.

In order to see the degree and direction of local deformation at any point, just hold your pointer still over that point and notice the degree of wiggle.

http://www.sharpprintinginc.com/911_misc/sauret_120-220.gif

Notes:

1) The east corner of the building stays pretty still. The whole portion below floor 98 stays pretty still.
2) The NW corner window washer actually wiggles east-west. Almost no downward displacement, but observable eastward displacement.

[qimg]http://www.sharpprintinginc.com/911_misc/nbc-sauret_120-220nwcorner.gif[/qimg]

3) Notice that the whole west corner above floor 98 is being pulled inwards. The pull-in first becomes noticable just above floor 98 and grows much stronger in the top few floors.
4) From this projection, the antenna is moving downwards and hooking to the east. It is as if it is falling and slightly pivoting. It seems as if it's eastward angle increases slightly over this interval.

[qimg]http://www.sharpprintinginc.com/911_misc/nbc-sauret_120-220ant.gif[/qimg]

How's your "degree of wiggle" while you watch this stuff?
 
The early WTC1 movements of the upper NW corner and the antenna are described in detail at these links:

Upper West Wall Pulls Inward 9.5s before Collapse

Antenna Base Shifts Eastward 9.5s before Collapse


This information was presented in this forum in early 2010(?). Posters at that time apparently couldn't understand what mappings of building movement had to do with discussion of 9/11/01 or the WTC towers and had the threads removed from this subforum.


Points tracked by Femr2:

[qimg]http://femr2.ucoz.com/_ph/6/2/365389893.jpg[/qimg]


HORIZONTAL DISPLACEMENT, NW CORNER

[qimg]http://femr2.ucoz.com/_ph/6/2/238393243.jpg[/qimg]
http://femr2.ucoz.com/photo/6-0-426-3

Camera shake is obvious (between frames 1150-1250).

Black thick line is horizontal movement of the NW corner.

Grey is raw NW corner.

Blue is static point.

(Remember there would be a time delay between event and camera if indeed the source of shaking originated from WTC1)


Tracked points by achimspok of NW corner and antenna:

[qimg]http://img717.imageshack.us/img717/697/xcomponentstatic1.png[/qimg]
Larger version here


..................


These movements must be seen as only a part of a larger mapping of early movement consisting of 9 distinct indentifiable events. Features of the initial failure sequence can be understood as a rapid succession of 9 identifiable events occurring in the following order:


1) Deformations: Inward bowing of the south face
2) Earliest detectable creep movement of the antenna and northwest corner
3) Appearance of ~87th fl S face ejections
4) Appearance of 95th fl W face ejection
5) Visible downward movement begins: Columns fail over tilt of less than 1 degree, appearance of 98th fl ejections
6) Appearance of 77th fl W face ejections
7) Splitting of all perimeter walls: All visible upper parts fall out and over lower parts
8) Southward sliding of upper portion
9 ) Dis-integration of upper portion

Detailed summary of these 9 events available at this link:

....2.3: WTC1 Accurate Collapse History


All claims are verifiable and all methods are reproducible.

Note that visible movement does not begin until item #5.

Do both of those graphs have metres as the vertical scale or is the Femr2 one in pixels?
 
No, you are an obvious poe/troll. Stay on topic.


Could you tell me by what means WTC1 was set in motion >9s prior to release ?

:crazy:

What makes you think this "early motion" happened?

Edit: Calling me a "Poe" - in other words implying that my opinions are over the top crazy - does nothing to strenthen your argument. Ad hominem attacks like these just make it more clear that you are unwilling to question your blind faith in the government's "collapse videos" which have been spoonfed to you by the mass media.
 
Last edited:
What makes you think this "early motion" happened?

1) Scrubbing through magnified views of the videos...you can see a good proportion of it.

2) Trace data from multiple sources has revealed it time and time again. Such sources include NIST, Achimspok, OneWhiteEye and myself.

There is zero doubt about the existence of early motion, all of which can be replicated by anyone willing to perform the feature tracing themselves. Techniques vary between those who have already done so, reinforcing the validity of the resultant identified motion.

NIST used their moire techniques, I use sub-pixel accurate region based pattern matching facilities available in packages such as SynthEyes.

All of this information has been presented many times.

I suggest you read back through threads.
 
1) Scrubbing through magnified views of the videos...you can see a good proportion of it.

2) Trace data from multiple sources has revealed it time and time again. Such sources include NIST, Achimspok, OneWhiteEye and myself.

There is zero doubt about the existence of early motion, all of which can be replicated by anyone willing to perform the feature tracing themselves. Techniques vary between those who have already done so, reinforcing the validity of the resultant identified motion.

NIST used their moire techniques, I use sub-pixel accurate region based pattern matching facilities available in packages such as SynthEyes.

All of this information has been presented many times.


:words:

I suggest you read back through threads.

No.
 
Last edited:
Perhaps some pictures will help you then...

Firstly, you need to appreciate the fine motion detail detectable using sub-pixel tracing methods.

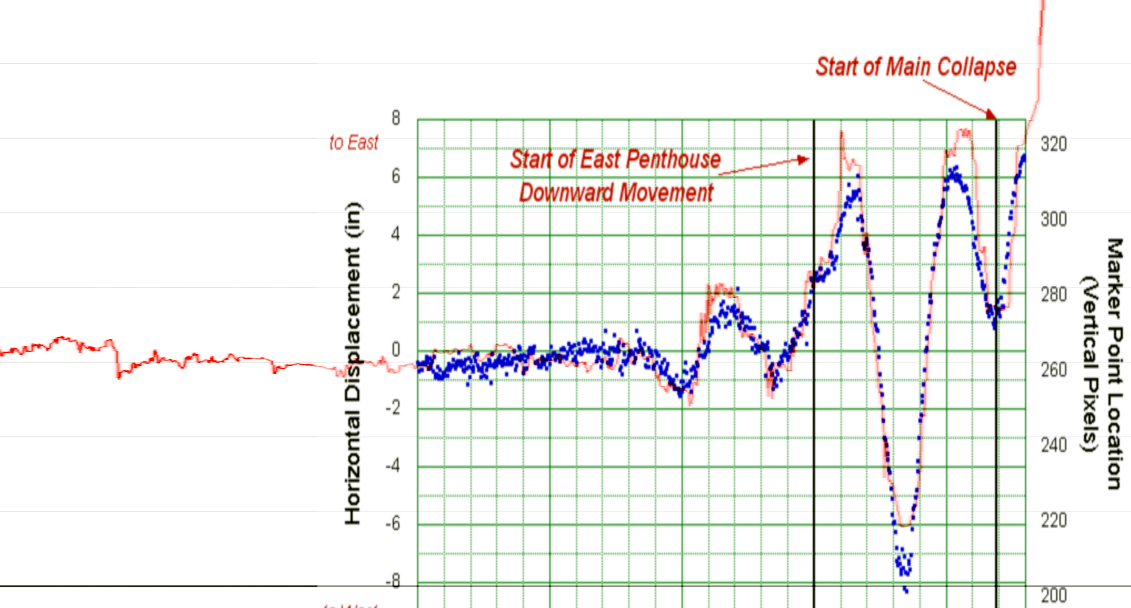
A comparison between the NIST moire method and my SynthEyes based tracing methods, for motion of the West edge of WTC7...


Note the displacement scale... in inches.

It is possible to detect motion in the order of an inch, from this footage...


As further evidence of the accuracy of sub-pixel tracing methods, consider the motion of WTC2 following impact...

NIST (moire method)...
[qimg]http://femr2.ucoz.com/_ph/2/2/131016691.jpg[/qimg]

femr2...
[qimg]http://femr2.ucoz.com/_ph/2/2/468976343.jpg[/qimg]

Note the displacement scale...inches.

Note the significant reduction of noise in my data.

Same thing in pixels...
[qimg]http://femr2.ucoz.com/_ph/2/2/151216157.jpg[/qimg]

All that motion is "sub pixel".

So, applying the same process to footage of WTC7 several minutes prior to release reveals...

NIST (no static point subtraction - camera motion not removed)...
930069773.png


femr2...


...which is a view of ...


...you should see that in addition to the late motion shown by NIST here...


...clear and obvious early motion is present.
 
Last edited:
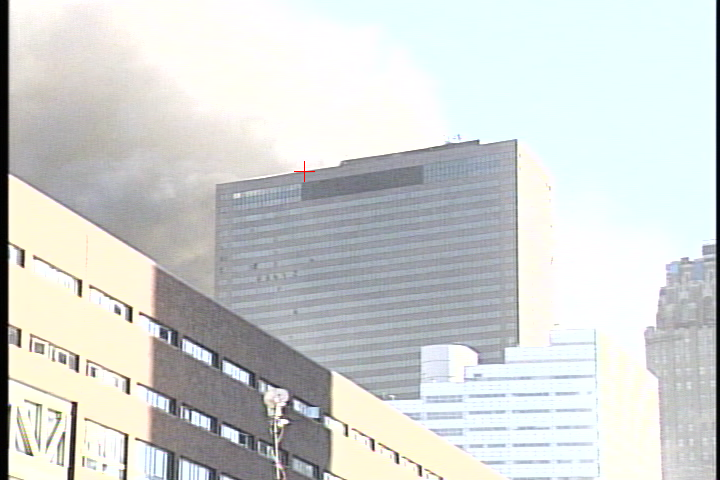
could you add some explanations to the beginning of that text where the camera is (north of the north tower, I presume? But where? How far? How high?

The Sauret footage was filmed from here...

878183310.png


Details, and discussion, of height are in the forum (a few times), as folk decided to speculate with vigour about the cause of the camera shake.

Around 7th Storey iirc.
 
Femr2 and tfk,

I have an idea how we could settle experimentally whether any of your methods is capable of figuring out real trends and magnitudes of acceleration:

I invent a fantasy WTC7. That is, I model the descent of a point similar to that of the roof corner, but I get to be God, and I pre-determine the mathematical function by which it descends. I'll make it exhibit similar features, such as some pre-release motion, increasing and decreasing acceleration, a will come near g or perhaps reach or exceed it, etc. But this will happen in the form of clean functions:
  • Perhaps some sinus for periodic stuff
  • Perhaps some logarithms for dampening
  • Perhaps there'll be periods of constant a or constant v, or even constant d
  • Polynomials of max. degree 4
  • Hmm maybe I can think of one or two more basic shapes
Obviously, the whole motion won't be described by just one equation - I'll stitch it together as a series of, say, 6-8 phases. In each phase, I might add two or even three of those basic shapes - say, during what is mainly a parabola fall, we see a dampened oszillation of a. Something like that.

I'll have to think hard and dig deep in my old and very dusty math box to figure out how to make the transitions smooth. Gonna be some prep work on my part...


I will then sample this clean, mathematically exact curve which I, God, declare to be Reality, at a frame rate close to 30 Hz

In the first step, I'll add some random noise to the displacement data and give you that data set
Then I'll ask you to analyse it and plot your best estimates for d, v and a. The usual questions:
  • Where do you place t0 (and d0)?
  • Does a reach g?
  • Does a exceed g?
  • Is there a period of a = g, on average?
  • Is there a period of a = g, constantly?
  • Can you guess the functions?

In the second step, I'll give you sampled data of the same function, again at 30 Hz, but this time without added random noise. Only rounding error (plenty of decimals)
You'll answer the same questions again.

(Or perhaps I should re-sample with new error margins added?)


After you have given me your best guess of what the Real action was (The Will of God), I will reveal the actual functions and plots, and then we'll see who deviated farther from The Will of God.


How about it? Different thread then of course.
Bump for tfk.

I accept Oystein's kind offer.
 
Bump for tfk.

I accept Oystein's kind offer.
Could you explain what the point is in this "challenge"? Is it bragging rights?

Why don't we fianally cut to the chase and make a case for why any of this matters?

OK?

If you say you got the best data, great. Ten years from now someone will break it down one more millisecond. Does that mean your data is no good?

If you can't show a usefullness for this information, then it's not really of any use.


My challenge:

Show how your data is of use.
 
Could you explain what the point is in this "challenge"?
Did you not read even the first sentence of Oysteins post ? ...

"how we could settle experimentally whether any of your methods is capable of figuring out real trends and magnitudes of acceleration"

If you are unaware of why one may want to do such, then I will simply, and respectfully, say "one page memory".

Show how your data is of use.
Going round and round the hamster wheel is not going to happen.

Among many other things I could say, I will simply say "early motion".

If you are still in the dark, and have read these discussions, there's nothing more to say.

You ask questions over and over again. You get answers and you ask the same questions over and over again.

Going round and round the hamster wheel is not going to happen.

Among many other things I could say...
 

ISF - Join now!

Every member here is approved by hand. No bots, no spam, just people who care about evidence and honest debate.

Membership is free!

Create your free account

Back
Top Bottom