• You may find search is unavailable for a little while. Trying to fix a problem.

[Continuation] Global warming discussion V

Note that CO2 emissions vary, e.g. due to economic forces, so looking at a couple of years is not useful. You need to look at periods that smooth out economic cycles. Picking out last 2 years ignores the plateau from 2014-16.

Do you even read what you type?

You're saying to ignore a trend of only two years because it doesn't count in the face of a trend of only two years immediately prior. Those two years are the aberration - in case you hadn't noticed, CO2 emissions have increased every year since about 1860, with the odd exception.

Next up, pedestrian crossings are black on white, not white on black.

Whether the EU has reduced emissions means sweet FA if the rest of the world is increasing by more than those reductions.

There's a handy graphic in this article that might help you understand what a long-term trend is:

https://www.theguardian.com/environ...arbon-emissions-jump-to-all-time-high-in-2018

And Bolsinaro hasn't even started on the Amazon yet.

If you had a point, you certainly failed to make it. (again)

The only thing you got right is that recessions have more impact on emissions than any promises or overt action. Well done!
 
Do you even read what you type? ....
I did. I explained the basic fact that economics vary and thus CO2 emissions vary. There are economic boom and bust cycles. There are recessions. There are changes in governmental policies. There are changes n consumer patterns. An economist could probably come up with more reasons why economics varies.

I did not say ignore the last 2 years. I said they need to be included in a longer tern trend to smooth out economic variation. This is similar to solar variation. No one ignores the fact that the Sun has a 11 year cycle when looking at trends in global temperatures. We use the last > 11 years including the last 2 years of solar activity to calculate the current trend.

ETA: We cannot reliably use just 2 years rise to predict future CO2 emissions will rise at the same rate. There is a chance that emissions will return to a plateau as previously.

I know that CO2 emissions have increased since 1860. That is the science I cited: Global Carbon Budget 2018

The EU and other countries decreasing their CO2 emission merely suggests that countries such as the USA, China and India could do the same.

The science in Global Carbon Budget 2018 is part of the Guardian article you linked: 'Brutal news': global carbon emissions jump to all-time high in 2018

The point I made successfully was
That imaginary "load of people" will tell you that globally CO2 emissions continued to increase with the main sources being the USA, China and India. The EU though has decreased CO2 emissions since 1990. This is well known.
Global Carbon Budget 2018.
 
Last edited:
Two years in a row, emissions have increased, with 2018 showing an increase very much in line with global GDP. https://www.theguardian.com/environ...-up-by-third-as-greenhouse-gas-emissions-rise
That is not quite what that news article says, The Atheist.
Global coal use up by third as greenhouse gas emissions rise
This is an article about greenhouse gas emissions from energy production, e.g. coal-fired power plants. They are not the only source of our CO2.
There is no mention of global GDP in the article. There is a "2.3% increase globally" in general energy demand with no breakdown into sectors. That figure alone is below global GDP of 3.5% (2017) AND 3.6% (2018).
 
ETA: We cannot reliably use just 2 years rise to predict future CO2 emissions will rise at the same rate. There is a chance that emissions will return to a plateau as previously.

And given that the "plateau" itself consists of 2-3 years in a trend of 175 years, you're refuting your own point.

Yet again, but for god's sake don't admit that.

Yes, there's a chance they will slow again. There's also a chance they won't.

I think the latter is more likely. Give it five years and we'll know what they were, but given the long-term trend, world GDP growth and the fact that the "plateau" was very short-lived, I'd gladly bet a box of chocolate fish on it.

The EU and other countries decreasing their CO2 emission merely suggests that countries such as the USA, China and India could do the same.

No ****, Sherlock.

EVERY country COULD cut its carbon emissions, but it's not helluva likely in the three you mention. For god's sake, it was only last year a mass of Chinese factories were busted releasing CFCs. And still are, for that matter.

India won't slow its growth, which is what lowering carbon emissions would mean, and if you bothered checking out the bloke who's living in the White House and the people he's appointing to posts that impact on climate, you'd laugh at the idea that America is going to reduce emissions until it becomes financially imperative. That's a decade away at least.

You are aware USA withdrew from Paris, aren't you?

Do you even recognise how much easier it is for highly matured economies to go green than developing ones?

I love the way your name doesn't reflect your ability to acknowledge reality. Nice irony.

There is no mention of global GDP in the article. There is a "2.3% increase globally" in general energy demand with no breakdown into sectors. That figure alone is below global GDP of 3.5% (2017) AND 3.6% (2018).

Correct, which is why I pointed out how similar they were.

But there's an excellent example in your post that shows what I mean about reality - what the sector breakdown of CO2 emissions are is utterly irrelevant when discussing the increase overall. Yet you raise it as though an important piece of the puzzle is missing.

Pathetic.

I'm trying to figure out what you're trying to disagree with here, and I don't think you even know yourself.
 
And given that the "plateau" itself consists of 2-3 years in a trend of 175 years, you're refuting your own point. ...
My point is that you did not use that 175 years of data! :jaw-dropp!

My point is that the existence of countries who have reduced CO2 emissions such as the EU means it is physically possible for the USA, China and India to reduce their CO2 emissions. Whether it happens is a different matter. The politics are irrelevant for this thread.

My points are that global GDP (3.5% in 2017, 3.6% in 2018) are numbers that are not similar to a "2.3% increase globally" in general energy demand.
  • 2.3% is not close to 3.6%.
    When numbers are reported without errors, the error is generally +/- 1 in the last significant digit, i.e. 2.3 +/- 0.1 and 3.6 +/- 0.1.
  • The energy demand is not just fossil fueled energy demand.
    Energy demand includes solar and wind power.
    Energy demand includes hydroelectric power.
    Energy demand includes nuclear power.
    Fossil fueled energy demand will be less than 2.3%.
  • A percentage increase (2.3%) is not an annual measure (3.5% in 2017, 3.6% in 2018).
    The percentage increase in global GDP between 2017 and 2019 was 0.1%.
 
For comparison, that was 4o C (9o F) warmer than NZ's southernmost city, Invercargill, which is 10 degrees of latitude closer to the equator than Klawock.
Not a good comparison because Invercargill is different from Klawock.
Invercargill is at the bottom of the South island with Stewart Island below it. Invercargill is partially shielded by Stewart Island from cold southerlies but subject to weather funneled between the islands. Invercargill has the high ranges of the Southern Alps to the north.
Klawock is on the coast of a continent. Klawock is shielded by many islands (it is almost an inland city). There are at least hills all around Klawock. The weather will be different from Invercargill.

A more appropriate comparison of weather would be a South American city.
 
Not a good comparison because Invercargill is different from Klawock.

Wow, no wonder you use that name - you figured out they're different places. Pity you had to use Wikipedia to find out, but that's how it goes, I guess.

You really ought to see if you can go and buy a yourself a personality & sense of humour one of these days - I was making a casual observation rather than a scientific comparison. This is a discussion board as far as I'm aware, and your Romney-like blethering is both tedious and irrelevant.

(Since you're determined to attempt to be a clever clogs, you should also have pointed out that Klawock itself is a very poor example, being on an island in the Pacific Ocean not even remotely connected to the Alaskan mainland, and largely uninfluenced by Alaskan weather patterns due to the prevailing westerly jet stream.)

Pathetic. (3)

p.s. I've added a few links so you don't get lost in the plain English.
 
I reckon if I look back a thread or two on this subject, I'd find a load of people telling me that CO2 emissions were flat or falling.

Subsequent to the GFC, that was true, but seeing it as a trend has proven spectacularly wrong.

Two years in a row, emissions have increased, with 2018 showing an increase very much in line with global GDP. https://www.theguardian.com/environ...-up-by-third-as-greenhouse-gas-emissions-rise

Given the continuing rise and Trump's anti-AGW policies being enacted, I reckon you can lock in about 3 degrees, never mind the 2 in the Paris Accord.

I think this fight is just about over - buy high ground, sit back and watch.


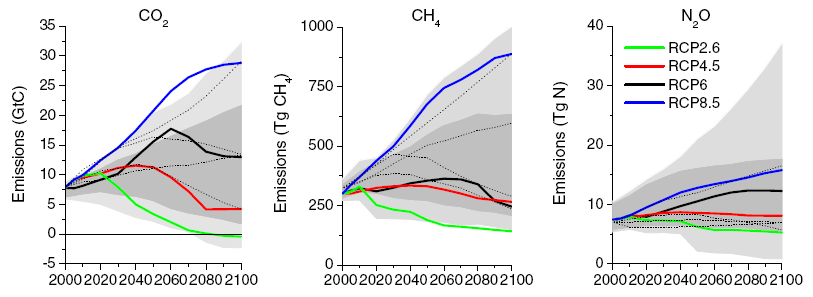
Sadly, you are probably being overly optimistic. The IPCC “business as usual” scenario where we don’t start to reduce CO2 emissions at some point places warming by 2100 between ~4-6 deg C above pre-industrial (1900ish) levels. Any projection lower than this includes at least some reduction in CO2 emissions.


emissions-graph-rpc.PNG


AR5_SYR_Figure_2.3.png
 
Sadly, you are probably being overly optimistic.

More than likely, but I try to look on the bright side. Economic pressure + insurance premiums rising sharply will force change.

Whether it's soon enough to matter is anyone's guess.
 
More than likely, but I try to look on the bright side. Economic pressure + insurance premiums rising sharply will force change.

Whether it's soon enough to matter is anyone's guess.

What cuts off CO2 emissions and saves us will probably end up being economic and social collapse.
 
Wow, no wonder you use that name - you figured out they're different places...
You were the one who causally compared weather in different places without checking whether their weather is different due to their different terrain!

Insults do not make a casual comparison correct. A "scientific comparison" assertion about my post pointing out that the casual comparison is wrong does not make the comparison correct.

I have the advantage of living in NZ and already knowing that Invercargill is a coastal city at the bottom of the South Island, sandwiched between Stewart Island and the Southern Alps. So I looked up Klawock and saw that it is a city on an large island (Prince of Wales) surrounded by islands and at least hilly terrain according to Google Earth. Different terrain alone makes the comparison wrong.
 
Last edited:
You were the one who causally compared weather in different places without checking whether their weather is different due to their different terrain!

Your dishonesty is becoming worse by the day.

I typed this, quoted from above:

For comparison, that was 4o C (9o F) warmer than NZ's southernmost city, Invercargill, which is 10 degrees of latitude closer to the equator than Klawock.

Typically, you're defending yourself against a strawman of your own making. A real David Seymour moment, well done.
 
Insult, repeating a foolish comparison and seasons ignorance?

Your dishonesty is becoming worse by the day...
Insults and repeating a foolish comparison, The Atheist.
You compare have cities in different terrains I did not point this out before but your comparison is also ignorant about seasons. Invercargill is in the Southern Hemisphere and starting autumn. Klawock is in the Northern Hemisphere and starting spring. Invercargill coming out of summer and being warmer than Klawock coming out of winter is not a surprise.

Another tiny flaw with the comparison is choosing the southernmost city in New Zealand when Klawock is not the northernmost city in North America.
 
Invercargill coming out of summer and being warmer than Klawock coming out of winter is not a surprise.

Finally, absolute proof you have no idea what you're even arguing about. You're dead right, Invercargill is usually warmer than Klawock at this time of year.

That's why I posted this:

For comparison, that was 4o C (9o F) warmer than NZ's southernmost city, Invercargill, which is 10 degrees of latitude closer to the equator than Klawock.

You know, your continual following me around threads and making incorrect or spurious points is verging on stalking, and this thread proves it - you haven't got the least idea what you're crying about, but you have some strange compulsion to challenge my posts to the extent that you're making strawmen and outright lying.

Like I said earlier - it is truly pathetic.
 
Meanwhile, in actual climate news, this struck me as pretty funny.

https://www.theguardian.com/environ...-advisory-group-report-warning-global-warming
Rather irresponsible politics is countered by responsible people reforming a scientific advisory group to complete the work it would have finished for the federal government.

The Advisory Committee for the Sustained National Climate Assessment was established under Barrack Obama's administration to provide scientific guidance based on the 4 yearly National Climate Assessment. A weak excuse to not renew their charter was that there was only 1 industry representative. The administration was not willing wait until April 2018 when advisory members would be rotated off.
Trump officials faulted climate panel for having only ‘one member from industry’
“It’s disturbing that the Trump administration dumped a scientific advisory committee for having too many scientists,” said Center for Biological Diversity senior attorney Howard Crystal, who filed the lawsuit to obtain the Commerce records.
 
...usual insults snipped...
You're dead right, Invercargill is usually warmer than Klawock at this time of year.
You still do not understand the Klawock, Alaska post.
Earth's Polar Cell is breaking up.

https://imgur.com/a/BHX7Hra

On Tuesday, Klawock, Alaska topped out at 70 degrees Fahrenheit. Note the cold areas on the right side of the image.

https://earther.gizmodo.com/it-was-70-degrees-in-alaska-this-week-1833492360
Klawock, Alaska was an example of not usual weather.

Earth's Polar Cell is breaking up. It is behaving differently in 2019 and has not recovered from the polar vortex split.

Extreme Weather: It Was 70 Degrees in Alaska This Week
Forget Cancun. Spring break in Alaska is where it’s at. Bizarre March warmth has engulfed the Frontier State, setting an all-time temperature record in the latest manifestation of a new climate gripping the Arctic.

On Tuesday, Klawock, Alaska topped out at 70 degrees Fahrenheit. That marks the earliest 70-degree Fahrenheit day ever recorded in Alaska. The previous record was set just three years ago when Klawock reached 71 degrees Fahrenheit on March 31. In comparison, many cities in the Northeast have yet to crack that mark.
(emphasis added).
 
Klawock, Alaska was an example of not usual weather.

Oh my god, you're making yourself a bigger fool that ever. That's the exact point I was making.

Writing it again with links and bolding doesn't get you a pass here - you've demonstrated time and time again you have no idea what you're typing, and you've just done it again!

For god's sake will you please figure out what you actually think, then check what I actually typed. This is so far beyond absurd it isn't even parody. You contradict yourself, you try to contradict me by repeating what I've typed. You just do not have a single clue.
 
These Scientists Did More Than Tell Us We Were Doomed

The authors of the IPBES report also gave us a road map out

IPBES Report Link: https://www.ipbes.net/sites/default/files/downloads/spm_unedited_advance_for_posting_htn.pdf

IPBES - The Intergovernmental Science-Policy Platform on Biodiversity and Ecosystem Services
The intergovernmental body which assesses the state of biodiversity and of the ecosystem services it provides to society, in response to requests from decision makers.

Table SPM.1. Approaches for sustainability and possible actions and pathways for achieving them: pages 32-35

Key Messages (document sections)
  1. Nature and its vital contributions to people, which together embody biodiversity and ecosystem functions and services, are deteriorating worldwide.
  2. Direct and indirect drivers of change have accelerated during the past 50 years.
  3. Goals for conserving and sustainably using nature and achieving sustainability cannot be met by current trajectories, and goals for 2030 and beyond may only be achieved through transformative3changes across economic, social, political and technological factors.
  4. Nature can be conserved, restored and used sustainably while simultaneously meeting other global societal goals through urgent and concerted efforts fostering transformative change

Sobering read, at the least.
 
Sobering read, at the least.
Agreed and not at all unexpected either.

Once I saw this:
Farming Claims Almost Half Earth's Land, New Maps Show

I began to realize if almost 1/2 the land is already in agriculture, and the vast majority of the rest of it is mountain peaks, glaciers, and deserts unsuitable for all life but the extremophiles. Then added to that thought my experience in agricultural methods and knowledge of what the conventional does to the life on that land. I knew this will crack and collapse catastrophically soon.

I mean seriously. You cant literally kill off 1/2 the planet with biocides every single year on purpose and expect a good outcome.:covereyes D'oh
 
This is, I hope, a good place to ask about net CO2 emissions (for want of a better word) that end up in the atmosphere.

A lot of such is obviously directly anthropogenic: burning fossil fuels, say.

Some is (only just) indirectly anthropogenic: clearing forests, say, for palm plantations or cattle ranches.

Some more indirect, such as methane leaks (methane becomes atmospheric CO2, after a delay).

How much, though, is due to "natural" effects of climate change? For example, warmer weather in boreal forests leads to massive die-offs of trees which leads to net atmospheric CO2; or more severe droughts lead to more ferocious and widespread forest fires (with much slower re-growth as the fires really do kill much more of the flora).

The airborne fraction has remained at ~45% since the industrial revolution. IOW the land and ocean carbon sinks absorb all the carbon released naturally and more than half the CO2 we release by burning fossil fuels.

It’s widely recognised that this cannot continue indefinitely and indeed that at the earth warms, it will slowly release naturally sequestered CO2. These slow feedbacks are a key player in glacial cycles for example, and provide the long term amplification required to turn small orbital wobbles into big climate chances.


These are slow effects however, and thus far have been swamped by our rapid release of fossil carbon. Of note, however, is that while we know these slow feedbacks exist and have powerful long term effects, they are not factored into current climate models or scenarios. Basically all IPCC projections ignore any and all effects that are not currently occurring, which means they are as conservative as reasonably possible with almost all risk on the side of them underestimating long term warming.
Thanks! :thumbsup:

There's another indirect contributor I'm interested in: increased natural methane emissions, e.g. due to thawing permafrost. I think I read, upthread, that the direct effects of this (i.e. more warming) are not (or not well?) modeled (maybe I didn't read carefully enough). The indirect effect is yet more atmospheric CO2.

Also, as the oceans become more acidic, will their ability to absorb atmospheric CO2 decrease? IOW, more generally, what's the expected trend for the "~45%"?

Realclimate has covered it a dew times but Methane probably isn't an issue long term, at least not directly.

http://www.realclimate.org/index.php/archives/2012/01/much-ado-about-methane/

http://www.realclimate.org/index.ph...of-methane-in-our-climate-in-five-pie-charts/

The thing to remember is that Methane only stays in the atmosphere for a decade or so. CO2 on the other hand stays in the atmosphere for centuries. CO2 also has a long tail, so ~10% of the CO2 we are releasing will still be in the atmosphere 100K years from now.

If you increase the amount of Methane you release there is a corresponding 1 time increase in atmospheric methane, and radiative forcing. OTOH if you increase the amount of CO2 you release, atmospheric CO2 and radiative forcing will rise for several centuries, so in spite of Methane nominally being a stronger greenhouse gas CO2 has a larger climate impact. IF Methane were released fast enough it could cause very rapid warming, but only for a couple decades before the Methane decomposed to CO2.


While such a release could be possible at the very least it's unlikely, and rates at which methane is release would need to be many orders of magnitude faster than what's currently observed.

This isn't to say arctic soils and permafrost are not an issue, they contain enormousness amounts of carbon, but even if this carbon is initially released as methane is becomes CO2 rather quickly. However, there is enough carbon stored there that the CO2 itself is a big problem.

Also, as the oceans become more acidic, will their ability to absorb atmospheric CO2 decrease? IOW, more generally, what's the expected trend for the "~45%"?

It's generally agreed that the oceans ability to hold CO2 drops as temperature increases. At the oceans continue to warm, therefor, at some point the worlds oceans will stop absorbing CO2 from the atmosphere and begin releasing CO2 into the atmosphere. All the anthropogenic ic carbon they have already absorbed and more could ultimately be released into the atmosphere.

Again though, exactly when or how much extra carbon is an unknown so this is not something built into current climate change scenarios.
 
Congratulations, humans - CO2 has passed 415 ppm!

C'mon, fire up those cars, we can do 500, easy.
 
Realclimate has covered it a dew times but Methane probably isn't an issue long term, at least not directly.

http://www.realclimate.org/index.php/archives/2012/01/much-ado-about-methane/

http://www.realclimate.org/index.ph...of-methane-in-our-climate-in-five-pie-charts/

The thing to remember is that Methane only stays in the atmosphere for a decade or so. CO2 on the other hand stays in the atmosphere for centuries. CO2 also has a long tail, so ~10% of the CO2 we are releasing will still be in the atmosphere 100K years from now...

Not saying you are wrong, but you may be missing some qualification and nuance in what you appear to be saying. This isn't, strictly speaking, in accord with what the geologic record demonstrates. The problem with large scale, rapid releases of CH4 is that they overwhelm the mechanisms of atmospheric degradation of CH4 to CO2, meaning that large releases of methane into the atmosphere, have the potential to linger for tens to hundreds of thousands of years, and all the methane that is degraded is merely degraded to the longer potential persistence problem of atmospheric CO2 all the while exasperating the background warming.

(Note I'm speaking more to Clathrate devolution than peat/tundra soil emissions.)

BTW, I see the science is still dragging toward the scenarios many of us understood and found well supported 2 decades or so ago.

Ice sheet contributions to future sea-level rise from structured expert judgment
https://www.pnas.org/content/early/2019/05/14/1817205116
Conclusions.
This study suggests that experts’ judgments of uncertainties in projections of the ice sheet contribution to SLR have grown during the last 6 y and since publication of the AR5. This is likely a consequence of a focused effort by the glaciological community to refine process understanding and improve process representation in numerical ice sheet models. It may also be related to the observational record, which indicates continued increase in mass loss from both the AIS and GrIS during this time. This negative learning (36, 37) may appear a counter intuitive conclusion, but is not an uncommon outcome: as understanding of the complexity of a problem improves, so can uncertainty bounds grow. We note that for risk management applications, consideration of the upper tail behavior of our SLR estimates is crucial for robust decision making. Limiting attention to the likely range, as was the case in the Intergovernmental Panel on Climate Change AR5, may be misleading and will likely lead to a poor evaluation of the true risks. We find it plausible that SLR could exceed 2 m by 2100 for our high-temperature scenario, roughly equivalent to business as usual. This could result in land loss of 1.79 M km2, including critical regions of food production, and displacement of up to 187 million people (38). A SLR of this magnitude would clearly have profound consequences for humanity.
 
Not saying you are wrong, but you may be missing some qualification and nuance in what you appear to be saying. This isn't, strictly speaking, in accord with what the geologic record demonstrates. The problem with large scale, rapid releases of CH4 is that they overwhelm the mechanisms of atmospheric degradation of CH4 to CO2, meaning that large releases of methane into the atmosphere, have the potential to linger for tens to hundreds of thousands of years, and all the methane that is degraded is merely degraded to the longer potential persistence problem of atmospheric CO2 all the while exasperating the background warming.

(Note I'm speaking more to Clathrate devolution than peat/tundra soil emissions.)

BTW, I see the science is still dragging toward the scenarios many of us understood and found well supported 2 decades or so ago.

Ice sheet contributions to future sea-level rise from structured expert judgment
https://www.pnas.org/content/early/2019/05/14/1817205116

David Archer, a climate scientist at the university of Chicago and one of the Realclimate contributors write this simulation where you can play around with this type of scenario.

http://www.realclimate.org/index.php/archives/2012/01/an-online-model-of-methane-in-the-atmosphere/
http://climatemodels.uchicago.edu/methane/


Here is the result for a really big Methane pulse (100Gt) occurring over a 5-year span (Much more rapid release than the one he’s looking at in hos blog post). This pulse is ~100X our current anthropogenic Methane emission and nominally ~100-200 years worth of equivalent CO2 at current emission rates. (Yearly CO2 emission is around 38Gt, CO2-eq is either 34X or 86X depending on what time horizon you select)

Notice that even the peak radiative forcing for such a pulse isn’t ridiculously high and CO2 once again dominates changes radiative forcing within 30 years and within 50 it’s almost as if the pulse never even occurred. Also note that there is no evidence such a large pulse and rapid is even possible in the foreseeable future. Basically we are talking about a 100000% increase in Methane emissions in the artic and nothing like that is occurring or immanent.

picture.php
 
I’m not entirely sure the model in my last post works for negative numbers, but here is what it shows if we were to immediately cut anthropogenic Methane emissions in half but keep emitting CO2 our current rate. The difference in radiative forcing is negligible in comparison to CO2.

picture.php
 
Industrial methane emissions are 100 times higher than reported, researchers say

Using a Google Street View car equipped with a high-precision methane sensor, the researchers discovered that methane emissions from ammonia fertilizer plants were 100 times higher than the fertilizer industry’s self-reported estimate. They also were substantially higher than the Environmental Protection Agency (EPA) estimate for all industrial processes in the United States.

...

The team discovered that, on average, 0.34% of the gas used in the plants is emitted to the atmosphere. Scaling this emission rate from the six plants to the entire industry suggests total annual methane emissions of 28 gigagrams – 100 times higher than the fertilizer industry’s self-reported estimate of 0.2 gigagrams per year.

In addition, this figure far exceeds the EPA’s estimate that all industrial processes in the United States produce only 8 gigagrams of methane emissions per year.

“Even though a small percentage is being leaked, the fact that methane is such a powerful greenhouse gas makes the small leaks very important,” said Joseph Rudek, co-author and lead senior scientist at Environmental Defense Fund. “In a 20-year timeframe, methane’s global warming potential is 84 times that of carbon dioxide.”
...
http://news.cornell.edu/stories/201...are-100-times-higher-reported-researchers-say


I suppose this is not helping.

:(
 
I suppose this is not helping.

:(

I'll tell you what else isn't helping: the deceitful way the idiotic term "gigagrams" is used. We already have a long-established term for weights of that size - the universally-known "tonne", 1000 kg. A gigagram is 1000 tonnes, so why use a term that makes the total sound and look much scarier than it actually is? The only time I've ever seen the term used is for methane or CFC emissions.

Global CO2 emissions are ~35 gigatonnes, 35 million tonnes.

The methane emission mentioned are 8 gigagrams, of 8,000 tonnes. Whilst indeed not helping, it's a drop in the ocean at 1/500th of a percentage point of the CO2 released worldwide.

Typical Greenmunist tactic. "8000 tonnes doesn't sound like much - that's a very small ship, and less than 10% of the heaviest trains. Gigagrams sounds like a lot, though!"

At a time when the world struggles with understanding the problem, using emotive terms doesn't help.

Keep it real, people. (not blaming the poster - you're just posting what's written)
 
I'll tell you what else isn't helping: the deceitful way the idiotic term "gigagrams" is used. ...
Papers try to use units that reduce redundant zeros and reflect the uncertainty. Writing 29000 ((±18000) tonnes per year as 29 (±18) Gigagram per year is basic scientific scholarship. Well known scientific scholarship is not deceitful or idiotic. The results are the same whatever units that are used - fertilizers plans emit ~100 times the self-reported amounts of methane. You even suggest that that these are standard unis used for methane emissions!

Industrial methane emissions are underreported, study finds

Estimation of methane emissions from the U.S. ammonia fertilizer industry using a mobile sensing approach
 
Last edited:
I'll tell you what else isn't helping: the deceitful way the idiotic term "gigagrams" is used. We already have a long-established term for weights of that size - the universally-known "tonne", 1000 kg. A gigagram is 1000 tonnes, so why use a term that makes the total sound and look much scarier than it actually is? The only time I've ever seen the term used is for methane or CFC emissions.

Global CO2 emissions are ~35 gigatonnes, 35 million tonnes.

The methane emission mentioned are 8 gigagrams, of 8,000 tonnes. Whilst indeed not helping, it's a drop in the ocean at 1/500th of a percentage point of the CO2 released worldwide.

Typical Greenmunist tactic. "8000 tonnes doesn't sound like much - that's a very small ship, and less than 10% of the heaviest trains. Gigagrams sounds like a lot, though!"

At a time when the world struggles with understanding the problem, using emotive terms doesn't help.

Keep it real, people. (not blaming the poster - you're just posting what's written)

In the literature Petagrams is the most common unit I see used for CO2 emission. Tonnes seems more common when reporting to the public. In either case you probably need some context to tell you how significant some new source is, especially when it comes to Methane where people tend not to know what is normal.

I generally follow climate science and I couldn’t tell you off the top of my head if this was a truly meaningful new emission. As a general rule though, As I’ve said previously, the risks associated with Methane are overblown. The real problem scenarios are either CO2 driven or unlikely to occur given out best current understanding.
 
In the literature Petagrams is the most common unit I see used for CO2 emission. Tonnes seems more common when reporting to the public. In either case you probably need some context to tell you how significant some new source is, especially when it comes to Methane where people tend not to know what is normal.

I'm at least slightly happy they haven't resorted to the present idiotic way of giving measures like "eight football fields long" or "as much as ten elephants".

I generally follow climate science and I couldn’t tell you off the top of my head if this was a truly meaningful new emission.

Pretty ho-hum overall, which is why I suspect they went with the scary number rather than tonnes.

Methane looks like about 5 gT/yr, so another 0.2% won't make a huge difference.

Mind you, there's an old saying about straws and camels' backs as I recall.
 
Last edited:
Methane looks like about 5 gT/yr, so another 0.2% won't make a huge difference.
Not a huge numerical difference. But climate science tells us that small changes in greenhouse gases can have large changes in climate. Methane is a more powerful greenhouse gas than CO2.

Industrial methane emissions are 100 times higher than reported, researchers say
“Even though a small percentage is being leaked, the fact that methane is such a powerful greenhouse gas makes the small leaks very important,” said Joseph Rudek, co-author and lead senior scientist at Environmental Defense Fund. “In a 20-year timeframe, methane’s global warming potential is 84 times that of carbon dioxide.”
 
Suspicion does not make scholarship wrong.

Is there a prize for lying about posts?

If so, you'd win it in perpetuity.

I did not say anywhere it was wrong.

For god's sake, read the posts you think you're discussing. You are as dishonest as any antivaxer or 1080 protestor.
 
Back
Top Bottom