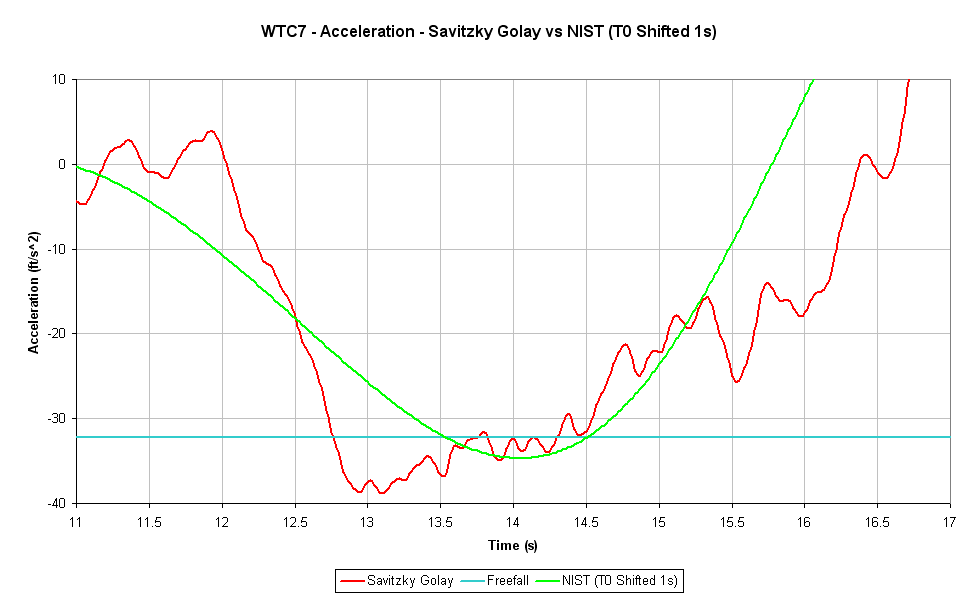
The important point is: There is a period of ~2 s of absolute g (FFA) [as close as can be measured] FFA means no resistance to any of the columns.
Besides showing unequivocally just how little understanding of basic physics you have, you're still drawing the wrong conclusion. The presence of over-g acceleration proves beyond doubt that there were more forces acting on the façade, thus completely invalidating your claim that FFA means no resistance.
Since we know you don't understand basic physics, we also know that you won't understand why that's so. But for the benefit of the rest, let me summarize it.
The resistance of the columns can be represented as a force, F1, pointing up.
The pulling down force that causes over-g at a certain point can be represented as another force, F2, pointing down. Remember my diagram.
Here F1 is represented by the arrows pointing up, and F2 is represented by the sum of the small arrows pointing down.
F1 *needs* to decrease as the columns buckle. You've pasted several times graphs that show that.
F2 is expected to decrease over time too, because there are no plausible mechanisms (that I can figure out) that can exert such force indefinitely; however, you're wrong about the duration of such force. There are several mechanisms that can make that force to last longer than you claim, and about 2 seconds is not unexpected.
Now, when F2 > F1, you get over-g.
When F2 = F1, you get g.
When F2 < F1, you get under-g.
Therefore, it's
FALSE that "FFA means no resistance to any of the columns". In reality, FFA means that the vector sum of forces (excluding gravity) give a NET result of zero.


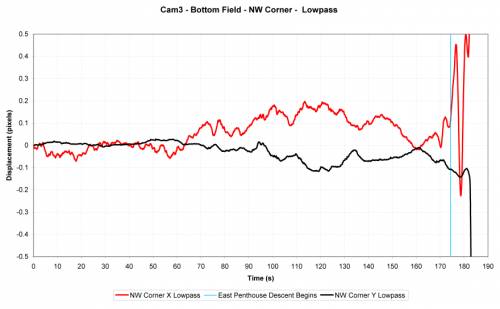
") Yes, the rate of acceleration was decreasing almost constantly (but not at a constant rate) after the NW corner had descended about 10ft.
Yes, the rate of acceleration was decreasing almost constantly (but not at a constant rate) after the NW corner had descended about 10ft.