Do you mean 12.5.3 ?I had not read chapter 12
How can you have had an opinion on the NIST data without reading that in advance ?
It's inaccurate, yes.Their Stage 1 is incorrect.
It doesn't work like that. That's basically dry-labbing. You don't "fix" things to get the result you want. There are not enough degrees of freedom in the NIST velocity function to capture any kind of subtle behaviour anyway.Their curved line is above the data points between 1.75 s and 2.5 s. Correcting these errors puts the displacement curve almost exactly on the FFA line for over 2 s.
Is the error that datapoint off out in the wilderness ? Probably. I don't have such extreme excursions in my data.
"Appears", good. Again, it depends what angle you look from. The building was undergoing quite complex flexure and twisting prior to and during descent. From the cam#3 viewpoint...it appears that everything but the west end starts down before the west end

...NW first there.
And...

Both early traces. Sure they could be improved these days, and noise reduced.
Not sure what you mean. I've provided Displacement, velocity and acceleration graph containing both NIST and my own data.Can you put your >g on the NIST FFA graph like they did with their displacement curve? That's what I was talking about when I said they could not be compared. But NIST did it so maybe you can.
You have WTC 7 falling at >g for about 1.6 s and as much as 38 ft/s2.
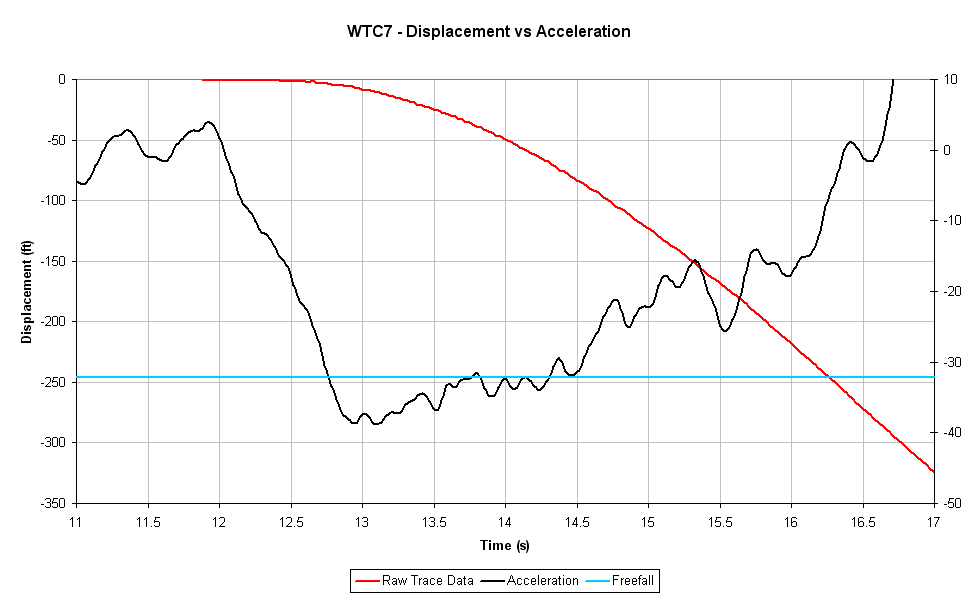
I suggest >g for ~1s. Note that maximum acceleration is reached before the building corner has descended 10ft. All slowing down from there on...
Not sure what you're after...I would like to see what that looks like on the NIST graph.
NIST displacement or velocity graph ? (They didn't publish an acceleration graph)
femr2 displacement, velocity or acceleration data ?
This might help you...
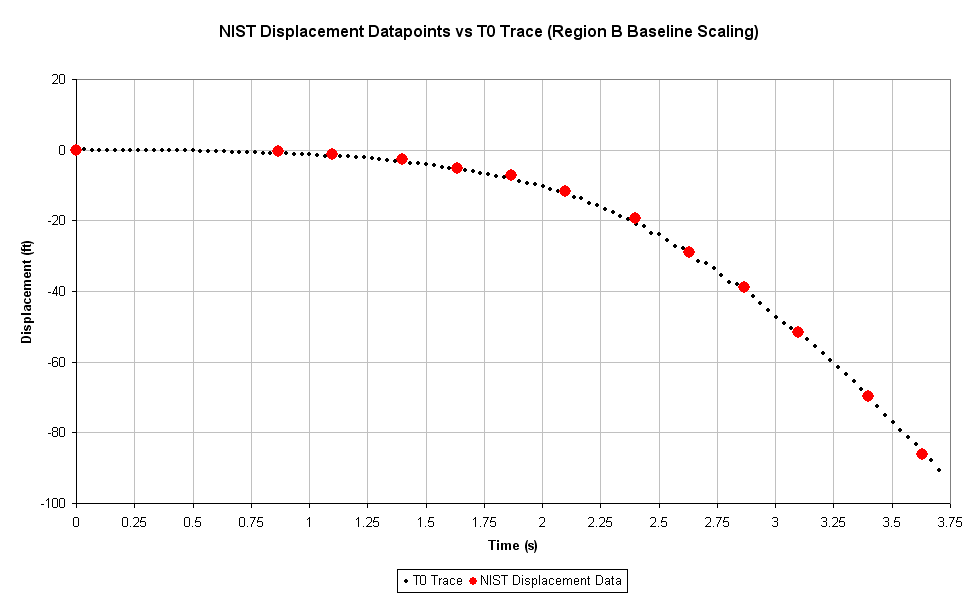
...my data is the small black dots. Lots more of them than the big red NIST dots. Note that they SHOULD be exactly the same, but NISTS do not match mine, including for that dodgy sample around the 1.75s mark.
What do you mean ?It will take some time to figure out how you got 2 + 2 to = 5.


 ) AND
) AND")
