Too bad you could not track the center of gravity. Too bad you can't track the roof collapsing thought the interior of the building in a gravity collapse. What kind of illumination is revealed tracking one of infinite points of WTC 7? Any conclusion to support your inside job claim?
You are using an out of date browser. It may not display this or other websites correctly.
You should upgrade or use an alternative browser.
You should upgrade or use an alternative browser.
Merged Discussion of femr's video data analysis
- Thread starter tfk
- Start date
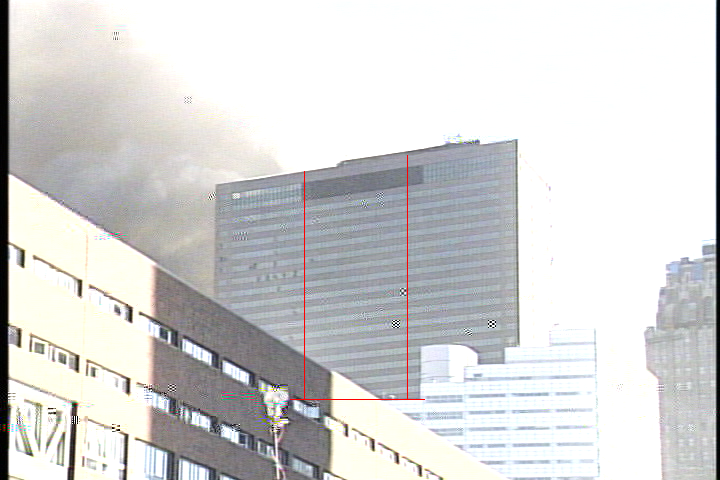
To support this assertion, the following image shows the roofline above Region B for the first 5 NIST datapoints (Including T0)...I assert again that the NIST positional trace above region B was started at least 0.86 after T0 as the rooftop buildings were still in place...and they recorded no positional data during that period.
The late start is still an issue, as the rooftop structures were still visible 0.86s after T0 and so still obscuring the roofline.
This suggests that either the NIST positional trace was started using the rooftop structures, or the trace was performed manually.

As you can see, the roofline structures are still visible for the first 4 datapoints, and the roofline cannot be determined by automated tracing techniques. Regardless of whether NIST used the rooftop structure or guessed the position of the roofline manually, it speaks volumes for their data quality and/or validity.
The "global collapse" of the building began at or before the point in time when the East mechanical penthouse fell into the building. Assigning "t=0" to some time that was 5 seconds, 6 seconds, or 7.34587664838361727 seconds after the penthouse collapsed is meaningless, whether it's femr2 or NIST doing so.
ETA - Meaningless in terms of describing what happened to the building, and how this is relevant to any other building, that is.
ETA - Meaningless in terms of describing what happened to the building, and how this is relevant to any other building, that is.
Last edited:
DGM
Skeptic not Atheist
The "global collapse" of the building began at or before the point in time when the East mechanical penthouse fell into the building. Assigning "t=0" to some time that was 5 seconds, 6 seconds, or 7.34587664838361727 seconds after the penthouse collapsed is meaningless, whether it's femr2 or NIST doing so.
ETA - Meaningless in terms of describing what happened to the building, and how this is relevant to any other building, that is.

alienentity
Illuminator
- Joined
- Feb 21, 2009
- Messages
- 4,325
as you can see, the roofline structures are still visible for the first 4 datapoints, and the roofline cannot be determined by automated tracing techniques. Regardless of whether nist used the rooftop structure or guessed the position of the roofline manually, it speaks volumes fortheir data quality and/or validity.number of assumptions femr2 is making without any real verification
ftfy
")
alienentity
Illuminator
- Joined
- Feb 21, 2009
- Messages
- 4,325
ie Femr2 does not understand how it was measured, doesn't know how it was measured, so therefore he feels this invalidates the measurements.
But it doesn't invalidate them, because Femr2 cannot give any valid proof beyond his own opinion - which frankly doesn't amount to much.
But it doesn't invalidate them, because Femr2 cannot give any valid proof beyond his own opinion - which frankly doesn't amount to much.
alienentity
Illuminator
- Joined
- Feb 21, 2009
- Messages
- 4,325
The "global collapse" of the building began at or before the point in time when the East mechanical penthouse fell into the building. Assigning "t=0" to some time that was 5 seconds, 6 seconds, or 7.34587664838361727 seconds after the penthouse collapsed is meaningless, whether it's femr2 or NIST doing so.
ETA - Meaningless in terms of describing what happened to the building, and how this is relevant to any other building, that is.
As NIST defined it that's not accurate, if I understand their timings. They call 'global collapse' the period when the whole North face began to descend, tilt, twist etc... on its way to the ground.
Yes, I know it's a quibble, because it doesn't change the reasons that the building collapsed. It's an arbitrary marker, after all.
Correct, though as I have highlighted, the roofline cannot be detected via automated tracing methods, as the rooftop structures are still in-place and the roofline is not discernable due to extreme lack of contrast.Femr2...doesn't know how it was measured
You have previously asserted...
...yet after 5 requests you have still not uploaded your trace data, nor provided any details.It is perfectly possible to select a point on the parapet wall somewhere more or less directly above the final point using motion tracking software.
I've done it using a couple of different programs myself so I can assure you.")
So...
- What motion tracking software did you use ?
- What location did you track ?
- What source video did you use ?
- Please upload your trace data.
I rather suspect you are being dishonest.
I am rather experienced in the motion tracking software available and more than experienced in the limitations involved when attempting to retain a latch on low-contrast features...so I say...
You cannot latch on to the roofline above region B in the Cam#3 footage during the first 2 seconds following NIST T0.
You spent a couple of pages recently demonstrating your utter lack of understanding of a simple graph, and have hand-waved being called on it. If you think that means that others here, who choose not to criticise you for it, don't cleary see how stupid you were being, then I'm sure you are mistaken.
This is slightly different. You have made a personal claim, which I suggest is plain BS.
Please provide your trace data and answer the questions above. I request that others support this request.
ETA: Bear in mind that I have recently developed methods to detect the actual NIST T0 pixel and frame (which required checking the brightness of over 4 billion pixels) and am more than likely going to digitise the NIST displacement data and apply similar brute-force methods to detect the actual point NIST used for displacement trace.
Last edited:
No femr2, as usual you posted a graph with unclear titles. "Datapoint pair" as an axis label for what you posted is very unconventional. I have never, ever seen that and wouldn't have guessed what it was. Indeed, the first two images found when searching google for "datapoint pair" areYou spent a couple of pages recently demonstrating your utter lack of understanding of a simple graph, and have hand-waved being called on it.
ETA - Paired data has a specific meaning in statistics. It does not mean "subtract the time between observations."
Last edit - Again, the NIST graph is conventional, clear and easy to read. The time elapsed is shown on the x-axis. There is no need to mess with it and start subtracting time. It's right on the chart, right where you would expect it to be.
AE - fair point on the quibble.
Last edited:
Hmmm...No femr2, as usual you posted a graph with unclear titles.
Graph Title - NIST Figure 12-76 Datapoint Spacing
x-Axis Title - Datapoint Pair
y-Axis Title - Separation (s)
Titles look pretty clear to me.
It is appropriate. The only other suggestion was from WDC, and was... "i" and "xi-xi-1"."Datapoint pair" as an axis label for what you posted is very unconventional.
What would you use ?I have never, ever seen that and wouldn't have guessed what it was. Indeed, the first two images found when searching google for "datapoint pair" areyour graphsyour graph and a NIST graph with your quote from this thread. I would never expect someone to use the term "datapoint pair" to describe a graph that plots the time interval between observations of something.
Regardless, AlienEntity was told several times, very early in the discussion...
It's a graph I made by recording the time between each of the datapoints in figure 12-76.

See that black circle where the two axes intersect ? T0, with a datapoint marker.
See the next one ? ~0.86s.
My graph shows the datapoint spacing, thus the title...
"NIST Figure 12-76 Datapoint Spacing"
...and the axis labels...
"Separation (s) / Datapoint Pair"
I CLEARLY state and label the x axis...Datapoint PAIR.
First point on my graph is for the time between the TWO datapoints, at T=0 and T=0.86
One is NISTs position/time graph, the other is a graph of the amount of time between each pair of datapoints on that graph. Clearly stated to you, repeatedly misunderstood by you.
Datapoint pair 1 on NIST Figure 12-76 (which is the pair of datapoints T=0 and T=0.86) has the value...0.86 on my graph.
etc...My graph shows the interval between each pair of datapoints in Figure 12-76. You should note that it is not a straight line, indicating that the separation is not constant.
One shows position/time data, the other separation/datapoint-pair.
It's really not difficult.
AlienEntity has no excuse, even if you are not a fan of the labels.
The need is to highlight inconsistent sample spacing. Automated methods do not function in such a way, suggesting that the trace was performd manually. That is the reason the graph was created.There is no need to mess with it and start subtracting time.
Assuming you mean his trace data... <tips hat>AE - fair point on the quibble.
tsig
a carbon based life-form
- Joined
- Nov 25, 2005
- Messages
- 39,049
Correct, though as I have highlighted, the roofline cannot be detected via automated tracing methods, as the rooftop structures are still in-place and the roofline is not discernable due to extreme lack of contrast.
You have previously asserted...
...yet after 5 requests you have still not uploaded your trace data, nor provided any details.
So...
- What motion tracking software did you use ?
- What location did you track ?
- What source video did you use ?
- Please upload your trace data.
I rather suspect you are being dishonest.
I am rather experienced in the motion tracking software available and more than experienced in the limitations involved when attempting to retain a latch on low-contrast features...so I say...
You cannot latch on to the roofline above region B in the Cam#3 footage during the first 2 seconds following NIST T0.
You spent a couple of pages recently demonstrating your utter lack of understanding of a simple graph, and have hand-waved being called on it. If you think that means that others here, who choose not to criticise you for it, don't cleary see how stupid you were being, then I'm sure you are mistaken.
This is slightly different. You have made a personal claim, which I suggest is plain BS.
Please provide your trace data and answer the questions above. I request that others support this request.
ETA: Bear in mind that I have recently developed methods to detect the actual NIST T0 pixel and frame (which required checking the brightness of over 4 billion pixels) and am more than likely going to digitise the NIST displacement data and apply similar brute-force methods to detect the actual point NIST used for displacement trace.
Where did you find that many pixels?
femr, the data points aren't pairs. I just can't think of any other way to say it. They aren't pairs. You called them "pairs." It's unconventional and unclear. NIST plotted the points along a timeline. There was no need for anything else.
Where did you find that many pixels?
720*480 image. 54 sample profile to match over 271 frames. 720*480*54*271.Again...There was no need for anything else.
The need is to highlight inconsistent sample spacing. Automated methods do not function in such a way, suggesting that the trace was performd manually. That is the reason the graph was created.
am more than likely going to digitise the NIST displacement data and apply similar brute-force methods to detect the actual point NIST used for displacement trace.
Even without doing such yet, I suggest the datapoint separation graph highlights what NIST did...
The T0 pixel is obscured behind foreground buildings around 4.7s after that time...which coincides with the change in datapoint separation seen for the last 5 samples in 12-76.
I suggest NIST swapped tracking point for those last 5 samples to a location above Region B.
Last edited:
DGM
Skeptic not Atheist
How does this effect the main thrust of their work?Eeew...
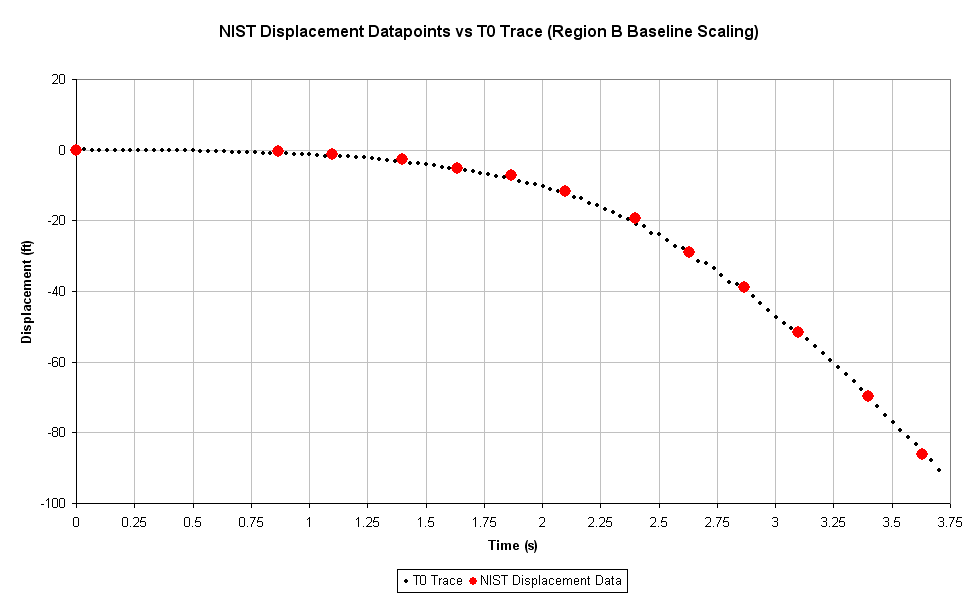
If one performs a trace from the NIST T0 pixel location and frame, and scales it relative to the height determined for Region B...
[qimg]http://femr2.ucoz.com/_ph/7/2/646929437.jpg[/qimg]
...and compares it to the NIST displacement data...
[qimg]http://femr2.ucoz.com/_ph/7/2/314382096.jpg[/qimg]
...it fits.
Very poor.

Well, reviewing one small section has revealed...How does this effect the main thrust of their work?
The NIST data suffers from the following (non-exhaustive) series of technical issues, each of which reduce the quality, validity and relevance of the data in various measures...
- NIST did not deinterlace their source video. This has two main detrimental effects: 1) Each image they look at is actually a composite of two separate points in time, and 2) Instant halving of the number of frames available...half the available video data information. Tracing features using interlaced video is not a good idea. I have gone into detail on issues related to tracing of features using interlaced video data previously.
- NIST did not sample every frame, reducing the sampling rate considerably and reducing available data redundancy for the purposes of noise reduction and derivation of velocity and acceleration profile data.
- NIST used an inconsistent inter-sample time-step, skipping roughly every 56 out of 60 available unique images. They ignored over 90% of the available positional data.
- NIST likely used a manual (by hand-eye) tracking process using a single pixel column, rather than a tried and tested feature tracking method such as those provided in systems such as SynthEyes. Manual tracking introduces a raft of accuracy issues. Feature tracking systems such as SynthEyes employ an automated region-based system which entails upscaling of the target region, application of LancZos3 filtering and pattern matching (with FOM) to provide a sub-pixel accurate relative location of initial feature pattern in subsequent frames in video.
- NIST tracked the *roofline* using a single pixel column, rather than an actual feature of the building. This means that the trace is not actually of a point of the building, as the building does not descend completely vertically. This means the tracked pixel column is actually a rather meaningless point on the roofline which wanders left and right as the building moves East and West.
- NIST used the Cam#3 viewpoint which includes significant perspective effects (such as early motion being north-south rather than up-down and yet appearing to be vertical motion). It also means that each horizontal position across the facade requires calculation of a unique scaling metric, which NIST do not appear to have bothered to do.
- NIST did not perform perspective correction upon the resultant trace data.
- NIST did not appear to recognise that the initial movement at their chosen pixel column was primarily north-south movement resulting from twisting of the building before the release point of the north facade.
- NIST did not perform static point extraction(H, V). Even when the camera appears static, there is still (at least) fine movement. Subtraction of static point movement from trace data significantly reduces camera shake noise, and so reduces track data noise.
- NIST did not choose a track point which could actually be identified from the beginning to the end of the trace, and so they needed to splice together information from separate points. Without perspective correction the scaling metrics for these two points resulted in data skewing, especially of the early motion.
- NIST performed only a linear approximation for acceleration, choosing not to further derive their chosen displacement function.
- NISTs displacement function, if derived to obtain acceleration/time contains a ~1s period of over-g acceleration.
- NISTs displacement function, if derived to obtain acceleration/time does not suggest a 2.25s period of roughly gravitational acceleration.
- The displacement data appears to have been extracted initially from the T0 pixel column, but using the scaling factor determined for a point above Region B, further skewing the displacement data.
Not a great show of competence. Let us hope that a similar raft of issues is not present for other sections of the report. It'll all come out in the wash.
That list looks familiar...Well, reviewing one small section has revealed...
The NIST data suffers ... ...
Not a great show of competence. .... It'll all come out in the wash.
- NIST did not ...
- NIST did not sample every frame, ...
- NIST used an inconsistent inter-sample time-step, ...
- NIST likely used a manual ...
- NIST tracked ...
- NIST used the...
- NIST did not perform ...
- NIST did not appear ...
- NIST did not perform static point ...
- NIST did not choose a ...
- NIST performed only a ...
- NISTs displacement function, if derived ...
- NISTs displacement function, ...
What would your work be without NIST? NIST bashing for what reason?
Do you need to bash NIST to comprehend WTC 7 was a gravity collapse?
How does your analysis of WTC 7 support your claims the official theory is fictional? Does your work coupled with all the available evidence support a gravity collapse?