Within
this post I asserted that the NIST positional trace was started a period of time after the NIST T
0 due to rooftop structures still being visible and obscuring the roofline above
Region B at that point in time...
Following claims from AlienEntity that I was saying a trace above Region B was
not possible and
repeated assertion of the above I highlighted that the NIST positional data contained within
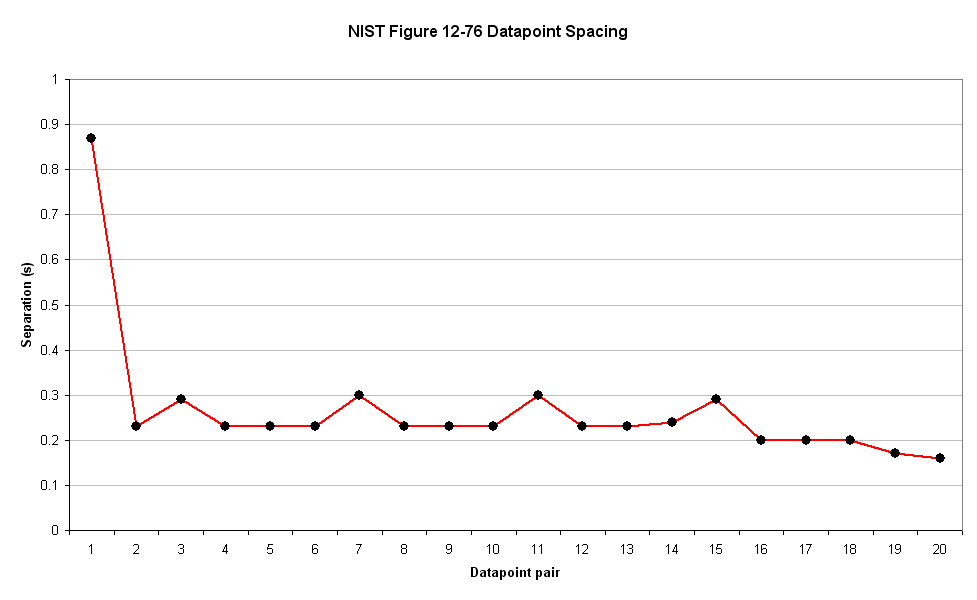
Figure 12-76 contains no datapoints between T=0 and T=0.86, by providing the following graph...

As the title and axis labels make clear, this graph shows the amount of time between each datapoint pair within
Figure 12-76 as a
Separation (s)/Datapoint-pair plot.
The first point on the graph above, datapoint pair 1, shows that the amount of time between the first
Figure 12-76 datapoint (at T=0) and the next is 0.86s which can be confirmed by inspection of
Figure 12-76 itself...
This detail was
explained to AlienEntity
on several occasions.
During the ensuing, er, discussion, AlienEntity made the following statements when repeatedly challenged that he wasn't reading the graph correctly:
- I can indeed read the graph. Don't be childish.
- Figure 12-76 in NCSTAR 1-9 doesn't look like the graph in your post!
- Uhm, using your own timescale (1second interval), unless you've graphed it incorrectly, datapoint 1 to datapoint 2 are about .6 seconds apart.
- Where is the datatapoint at T=0? Oh, it's missing. I checked 12-76 I see it is there in that graph.
- But the fact is you didn't plot the first datapoint at T=0. NIST does put their first point there in 12-76. You see? I really do understand.
- All data points are connected on the NIST graph, whereas yours is missing a red line to connect with the nonexistent first datapoint.
- Unlike the NIST data, which is presented with a black point for all the datapoints, yours omits the first one.
- ETA NIST calls theirs 'Velocity data points', you call yours 'datapoint pairs'. They are the same datapoints.
- 21 datapoints spread out in exactly the same time intervals in both graphs. Identical info, minus the displacement data.
- Hmm, and the datapoints just happen to be in the same positions as the NIST position/time graph?
AlienEntity is continuing to assert (in the previous post)...
I understand your graph perfectly. 
This is clearly not the case.
AlienEntity,
Please take your time and review the above.
Please ensure that you understand the content of the graph.
I assert again that the NIST positional trace above region B was started at least 0.86 after T
0 as the rooftop buildings were still in place...and they recorded no positional data during that period.
The late start is still an issue, as the rooftop structures were still visible 0.86s after T
0 and so still obscuring the roofline.
This suggests that either the NIST positional trace was started using the rooftop structures, or the trace was performed manually.





 You're really smart, aren't you


