I see you need reminding of the discussion. No problem. I'll summarise it for you in a short while.Oh, you mean when you extracted datapoints from NIST 12-76, graphed them in a different way and then pretended they were different information?
You are using an out of date browser. It may not display this or other websites correctly.
You should upgrade or use an alternative browser.
You should upgrade or use an alternative browser.
Merged Discussion of femr's video data analysis
- Thread starter tfk
- Start date
alienentity
Illuminator
- Joined
- Feb 21, 2009
- Messages
- 4,325
I see you need reminding of the discussion. No problem. I'll summarise it for you in a short while.
Just answer the question regarding error bands please.
alienentity
Illuminator
- Joined
- Feb 21, 2009
- Messages
- 4,325
You seem to think NIST plotted datapoint spacing somewhere. They didn't. "The NIST graph does a better job of presenting the data" ?? ROFL. Totally different graph content and purpose.
Yes, they did plot datapoint spacing, it's right in 12-76. And that's how you got your data - LOL.
The content is the same data, plotted in a different way. Yours simply excludes the velocity data. As Clinger put it, it's a subset of the NIST data.
Not new, not different. ETA but let's not bore everyone by retreading this ad infinitum. Why don't you spend some time coming up with the error bands in m/s2 for your data? Expressing it in pixels is not helpful in that regard.
Last edited:
No, I'm afraid our prior discussion needs a recap.Just answer the question...
It might take me a while (there's an awful lot of it to wade through) so by all means continue with what you are saying.
You could also estimate the error band yourself if you like. Whatever value I provide will spark all manner of silly discussion I imagine, regardless of how much supporting info I provide with it. tfk's suggestion was something like +/- 40G if I recall correctly
") Cool. Or pick a number and make your point.
Cool. Or pick a number and make your point.Regardless, a bit of wading to do for a bit.
alienentity
Illuminator
- Joined
- Feb 21, 2009
- Messages
- 4,325
No, I'm afraid our prior discussion needs a recap.
It might take me a while (there's an awful lot of it to wade through) so by all means continue with what you are saying.
You could also estimate the error band yourself if you like. Whatever value I provide will spark all manner of silly discussion I imagine, regardless of how much supporting info I provide with it. tfk's suggestion was something like +/- 40G if I recall correctly
Regardless, a bit of wading to do for a bit.
Whatever you like. Dodge noted. It is curious that someone such as yourself, who is obsessed with knowing every detail, would overlook a simple issue such as the error band for acceleration.
It's almost as if you don't want to know that info....
ps if you're going to spend time on the graph subject, why don't you take the time to make your graph clearer by plotting the T=0 point, which you left out, and tracing the red line (which you also omitted) from it to the 2nd datapoint? Unless you don't care about such details, of course...
Last edited:
Continued confirmation of utter lack of understanding noted.ps if you're going to spend time on the graph subject, why don't you take the time to make your graph clearer by plotting the T=0 point, which you left out, and tracing the red line (which you also omitted) from it to the 2nd datapoint? Unless you don't care about such details, of course...
I'd estimate about +/- 3ft/s2
alienentity
Illuminator
- Joined
- Feb 21, 2009
- Messages
- 4,325
Continued confirmation of utter lack of understanding noted.
I'd estimate about +/- 3ft/s2
I understand your graph perfectly.
")
Thank you for the estimate.
Within this post I asserted that the NIST positional trace was started a period of time after the NIST T0 due to rooftop structures still being visible and obscuring the roofline above Region B at that point in time...

Following claims from AlienEntity that I was saying a trace above Region B was not possible and repeated assertion of the above I highlighted that the NIST positional data contained within Figure 12-76 contains no datapoints between T=0 and T=0.86, by providing the following graph...

As the title and axis labels make clear, this graph shows the amount of time between each datapoint pair within Figure 12-76 as a Separation (s)/Datapoint-pair plot.
The first point on the graph above, datapoint pair 1, shows that the amount of time between the first Figure 12-76 datapoint (at T=0) and the next is 0.86s which can be confirmed by inspection of Figure 12-76 itself...

This detail was explained to AlienEntity on several occasions.
During the ensuing, er, discussion, AlienEntity made the following statements when repeatedly challenged that he wasn't reading the graph correctly:
AlienEntity is continuing to assert (in the previous post)...
I understand your graph perfectly.
This is clearly not the case.
AlienEntity,
Please take your time and review the above.
Please ensure that you understand the content of the graph.
I assert again that the NIST positional trace above region B was started at least 0.86 after T0 as the rooftop buildings were still in place...and they recorded no positional data during that period.
The late start is still an issue, as the rooftop structures were still visible 0.86s after T0 and so still obscuring the roofline.
This suggests that either the NIST positional trace was started using the rooftop structures, or the trace was performed manually.
Following claims from AlienEntity that I was saying a trace above Region B was not possible and repeated assertion of the above I highlighted that the NIST positional data contained within Figure 12-76 contains no datapoints between T=0 and T=0.86, by providing the following graph...
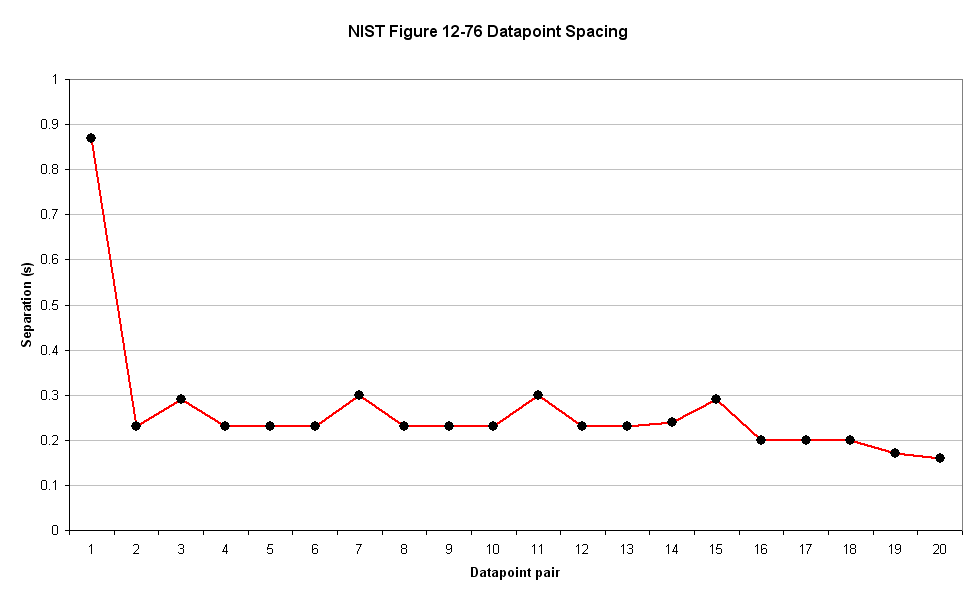
As the title and axis labels make clear, this graph shows the amount of time between each datapoint pair within Figure 12-76 as a Separation (s)/Datapoint-pair plot.
The first point on the graph above, datapoint pair 1, shows that the amount of time between the first Figure 12-76 datapoint (at T=0) and the next is 0.86s which can be confirmed by inspection of Figure 12-76 itself...
This detail was explained to AlienEntity on several occasions.
During the ensuing, er, discussion, AlienEntity made the following statements when repeatedly challenged that he wasn't reading the graph correctly:
- I can indeed read the graph. Don't be childish.
- Figure 12-76 in NCSTAR 1-9 doesn't look like the graph in your post!
- Uhm, using your own timescale (1second interval), unless you've graphed it incorrectly, datapoint 1 to datapoint 2 are about .6 seconds apart.
- Where is the datatapoint at T=0? Oh, it's missing. I checked 12-76 I see it is there in that graph.
- But the fact is you didn't plot the first datapoint at T=0. NIST does put their first point there in 12-76. You see? I really do understand.
- All data points are connected on the NIST graph, whereas yours is missing a red line to connect with the nonexistent first datapoint.
- Unlike the NIST data, which is presented with a black point for all the datapoints, yours omits the first one.
- ETA NIST calls theirs 'Velocity data points', you call yours 'datapoint pairs'. They are the same datapoints.
- 21 datapoints spread out in exactly the same time intervals in both graphs. Identical info, minus the displacement data.
- Hmm, and the datapoints just happen to be in the same positions as the NIST position/time graph?
AlienEntity is continuing to assert (in the previous post)...
I understand your graph perfectly.
This is clearly not the case.
AlienEntity,
Please take your time and review the above.
Please ensure that you understand the content of the graph.
I assert again that the NIST positional trace above region B was started at least 0.86 after T0 as the rooftop buildings were still in place...and they recorded no positional data during that period.
The late start is still an issue, as the rooftop structures were still visible 0.86s after T0 and so still obscuring the roofline.
This suggests that either the NIST positional trace was started using the rooftop structures, or the trace was performed manually.
Last edited:
This is where you're wrong. I have no problem with additional (and perhaps more accurate) data. Where you slip-up is not being able to show how it effects the over-all conclusions drawn. You're so concerned about "showing NIST up", you neglected the relevance..
In the case of WTC1 it means the core most probably failed first. The NIST report has the south wall failing with the rest fo the columns fauling diring significant tilt. There was no significant tilt until after all columns had completely failed.
Pretty significant, no? first WTC1, then WTC7. 9-11-01 was a bad day for cores. It is quite significant in that it the current NIST understanding of the WTC1 failure and stands it on its head.
And anyone can see both JREF and the NIST totally struck out with WTC1, you actually studied fake data instead. This was all explained many, many times on a thread where people femr's data, WTC1 feature list.
It was all explained over a long time and it was all ignored.
This should tell you that you are quite gullible for studying an imaginary building instead of a real one.
Even today, no real study of WTC1 early motion exists because the fake one is considered real. It seems the core fell out of the building but there isn't any science at all explaining why. You didn't notice because you were so transfixed on the fake data and fake collapse explanation.
So you say femr has pretty good data but you ignore everything he has told you about WTC1 such as early antenna and northwest corner motion and almost no tilt over the failure sequence.
One year of posting ignored. That, to you, is "science". That, to me, is "pitiful". Much information has been given but nobody will hold your hand and coach you through it all.
It is all there but you make no effort to look.
>>>>>>
Concerning WTC7 we see that same allergy to any real data before we even have it. Femr has had such good success on WTC1 that nobody knows what the data holds before we see it.
You should encourage the production of the best data so you don't study a fantasy building again like you did for WTC1. If you looked at real data instead of just believing the NIST you wouldn't have made such a serious blunder.
Last edited:
Maybe I'm pointing out the obvious, but if all you wanted was trend, a low-pass filter would probably have sufficed.They serve to filter out noise, and clearly reveal the underlying trend, as can be seen by comparison with simple symmetric difference derivation of acceleration which shows the same general profile but with much higher noise...
[qimg]http://femr2.ucoz.com/_ph/7/2/82136974.jpg[/qimg]
I am using a form of low-pass filter... The Savitzky-Golay filter...Maybe I'm pointing out the obvious, but if all you wanted was trend, a low-pass filter would probably have sufficed.
The Savitzky–Golay method essentially performs a local polynomial regression (of degree k) on a series of values (of at least k+1 points which are treated as being equally spaced in the series) to determine the smoothed value for each point. Methods are also provided for calculating the first up to the fifth derivatives.
The main advantage of this approach is that it tends to preserve features of the distribution such as relative maxima, minima and width, which are usually 'flattened' by other adjacent averaging techniques (like moving averages, for example).
Therefore, between 11s and 17s on my profile graphs, the Savitzky-Golay profile shows the result of 360 local polynomial fits of low order and narrow window (<1s).
Rather puts a lot of the discussion and criticism of the more generalised Poly(10) fit into perspective I think.
I'll be assessing the effect of variation in S-G filter paramters fairly soon, to see of there is scope for even higher detail being revealed.
Dave Rogers
Bandaged ice that stampedes inexpensively through
I'll be assessing the effect of variation in S-G filter paramters fairly soon, to see of there is scope for even higher detail being revealed.
Just don't bother with any filtering at all, and you'll be left with all the detail you started with. Sheesh...
Dave
True, however...Just don't bother with any filtering at all, and you'll be left with all the detail you started with. Sheesh...
Dave
Performing first and second order derivations from noisy data using adjacent samples will, of course, result in extreme amplification of that noise, and the end result is an indecipherable mess.
Some form of smoothing must be applied when using real-world data containing an amount of noise, be it using a wider sample window for each derivation, applying a moving average...or utilising per-sample localised polynomial fit (Savitzky-Golay).
Incidentally, that's why I insist in not drawing conclusions at least until I hear some qualified experts for the field under consideration, which F. Greening doesn't happen to be, but Myriad is.WIthin a few days of the NIST releasing their equation it was analyzed by Frank Greening [url='http://the911forum.freeforums.org/it-s-official-it-s-faster-than-free-fall-t91.html#p1212"]here[/url] . Note the date in 2008.
Note how the absence of physical meaning and t=o problems were spotted within days of it being released.
On the other hand, on fire-induced façade collapses...Dr Yarimer studies demolitions, as does Dr Lapa. There are many examples of demolitions, a great place to study these types of qualities, no?
Have you looked into it? Nowhere close to g acceleration in known demolitions.
http://www.youtube.com/watch?v=DZ1e3ddf3RM
OMFSM! You just proved that it was a fire-induced collapse!
Can anyone support that claim with argument? Show me another physical system that behaves according to those equations.
WIthin a few days of the NIST releasing their equation it was analyzed by Frank Greening [url='http://the911forum.freeforums.org/it-s-official-it-s-faster-than-free-fall-t91.html#p1212"]here[/url] . Note the date in 2008.
Note how the absence of physical meaning and t=o problems were spotted within days of it being released.
Whilst I don't contend the function of the three NIST parameters upon their resultant displacement function, suggestion of complex physical meaning of those parameters (and so the model) would be pretty ridiculous:Incidentally, that's why I insist in not drawing conclusions at least until I hear some qualified experts for the field under consideration, which F. Greening doesn't happen to be, but Myriad is.
- Two of them define the axes (displacement range[Y-scale], time[X-scale]).
- The other simply the shape of the exponential function.
Not exactly a far reaching model.
Whilst the resultant NIST displacement function provides a fairly(ish) reasonable(ish) fit to the displacement data, the derived velocity and acceleration functions have been shown, via comparison with my increased detail plots, to bear diminishing resemblance to the behaviour of the actual event.
Hardly surprising given that the NIST model is...a simple exponential function.
Now, given that...
- NIST only derived their displacement function to determine velocity (which clearly veers from their physical data towards the end of the plot)
- NIST only determined acceleration data via a linear regression using 10 datapoints over a time period of 2.25s...
...I find the level of support for >>>THE NIST MODEL<<<, especially in discussion of acceleration trend, to be more than a little bizarre.
I have provided high quality data, capable of retaining enough accuracy through second order derivation to show significant detail within the acceleration profile...
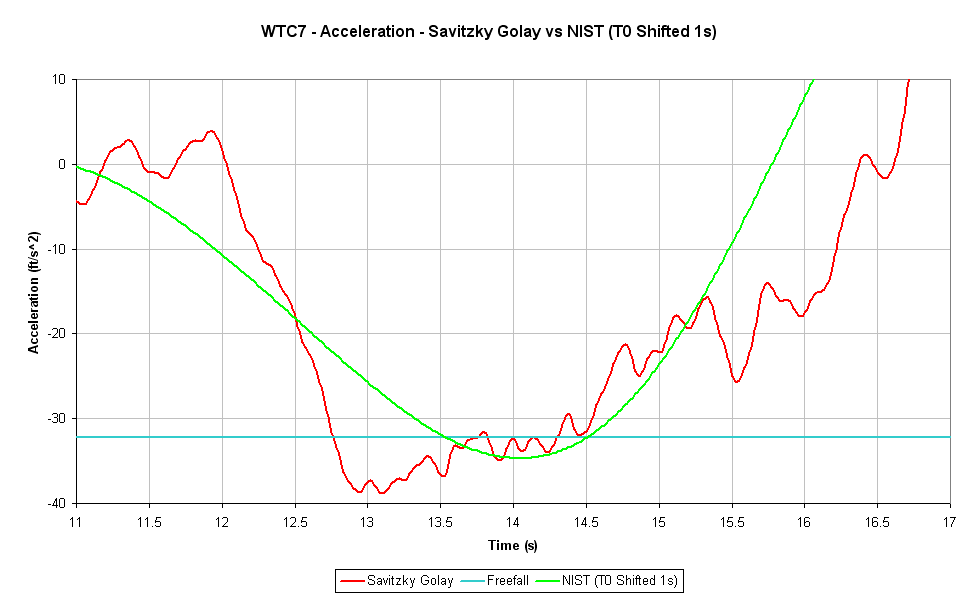
As you can see, a few significant differences, the T0 issue not the least of them.
I quite agree.Why not just use the s-g smoothing and move on? That lets you derive acceleration, reasonably reflects the limitations of the available data, and still shows in the data what seems to be your major points (if you ever go anywhere with them) about above-g acceleration and the timing of the phases.
If I may submit my impression: Here is my assessment of femr2's graph: NIST took measurements ("datapoint pairs") approximately every quarter of a second for approximately 5.5 seconds. But they skipped the ones at 1/4 of a second and 1/2 of a second.
So if one were to plot a graph where the first point were at y=0.75, and the rest of the points were at y=0.25, we would have a reasonable trend approximation of femr2's graph. Any wiggle apart from that is just small deviations in that trend.
I think his point is that perhaps nothing significant happened during that first 0.75=~0.86, so perhaps they were cheating because of that? Unsure, but to me that's all this graph means. Time spaces around 1/4 of a second, except for the first one, which is around triple that. Not sure what I'm supposed to glean from that. Fire at will.
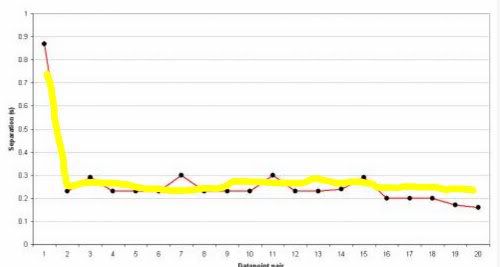
Incidentally, that's why I insist in not drawing conclusions at least until I hear some qualified experts for the field under consideration, which F. Greening doesn't happen to be, but Myriad is.
Have any qualified experts told you near g accelerations as witnessed are expected or normal?
It is now 2011. Were you ever going to bother to check whether near g accelerations are normal or expected?
Like the big blunder on the early WTC 1 movement, this shows how serious you are as a researcher. You never intended to lift a finger to check.
It also shows how out of touch you are with physical systems in general, since if any real analysis was done on the NIST curve the greater than g or near g accelerations would have stuck out like a sore thumb.
No sane human being could tell you that type of motion is expected or normal in a collapsing building, even one being demoed intentionally.
You'd really have to be living on cloud #9 to imagine that the WTC7 early acceleration profile is normal or expected for a building.
Perhaps if someone can produce one example recorded or filmed somewhere on earth of a building undergoing this range of acceleration you'd have a better case.
Last edited:
Did you not read my post above ?I think his point is that perhaps nothing significant happened during that first 0.75=~0.86
Fine, though I suggest ensuring that you read the thread so I don't have to repeat myself...Time spaces around 1/4 of a second, except for the first one, which is around triple that. Not sure what I'm supposed to glean from that. Fire at will.
- The positional trace was not started until T=0.86s
- Rooftop structures obscured the roofline at T=0s
- Rooftop structures obscured the roofline until T=~1.6s
- Until the rooftop structures had passed, automated tracing of the roofile would be effectively impossible.
- Automated tracing processes are extremely unlikely to use inconsistent inter-sample frame counts, suggesting the trace may have been performed manually.
- Data from T=0.86s onwards suggests that early samples used the rooftop structures, not the roofline.
Times are all relative to the NIST T0 of course, and this list may not be an exhaustive list of the features the datapoint separation data highlights.
W.D.Clinger
Philosopher
it doesn't even mean that. NIST's model got the boundary conditions right, and has only three parameters, so the placement of their second datapoint was noncritical.I think his point is that perhaps nothing significant happened during that first 0.75=~0.86, so perhaps they were cheating because of that? Unsure, but to me that's all this graph means.
femr2's high-order polynomial approximations ignore the boundary conditions, so the acceleration they show at the left endpoint of their training data (which femr2 refers to as T0) is quite sensitive to the positioning of that endpoint. At least one of femr2's criticisms of NIST's methodology is based upon his mistaken belief that NIST's nonlinear model is as sensitive to sample positioning as femr2's high-order polynomials. That's my best guess as to why he's been going on about NIST's sample positioning for the last several pages.
Prepare for another "whooshing" sound.
I'm in a high-rise right now. We aren't expecting near g accelerations, no.Have any qualified experts told you near g accelerations as witnessed are expected or normal?
It is now 2011. Were you ever going to bother to check whether near g accelerations are normal or expected?
True.You'd really have to be living on cloud #9 to imagine that the WTC7 early acceleration profile is normal or expected for a building.
Indeed. Things can only happen if they have happened before elsewhere and been filmed before. Solid logic.Major_Tom said:Perhaps if someone can produce one example recorded or filmed somewhere on earth of a building undergoing this range of acceleration you'd have a better case.