Moderated WTC 1 features list, initiation model / WTC 2 features list, collapse model

...
Friendly amendment: Myriad showed that, because the antenna is not in line with the north wall, the actual drop of the antenna would be more than an order of magnitude greater than the actual drop of the building edge.

Major_Tom's claimed linear relationship between a-b, b-r and r-98 is based on his implicit false assumption that the antenna is in line with the wall.

That was precisely my hunch, I was just too shy to write it down, as I, admittedly, did not take much time studying MT's argument and calculations, and feared I'd might make a fool of myself if I missed something.

Thanks for spelling it out!
 
False. Your line r is the roof line, not the base of the antenna. As Myriad's simplified calculations demonstrate, the base of the antenna drops much faster than the roof line. That's why b-r decreases much faster than a-b or r-98.

.......

Also the center of the south wall failed first unloading to the core through the two center roof trusses to the core columns supporting the antenna which began to drop ahead or concomitant to the propagating failure of the south wall to east and west, then the propagating failure of the east and west walls to the north, then the north wall and NW corner. MT calculated the failure of the NW corner lagged behind the failure of the SW corner by 0.5 seconds. The antenna at the center of the tower fell naturally earlier than the NW corner and its motion predictable.

Had the core columns failed before the south wall, the top would not have rotated. WTC7 fell vertically because the core columns failed before the exterior columns.
 
Last edited:
As others have figured out, my previous post did contain an error in the stated value of t3 for a 2 degree rotation (which was, due to the same error, also misstated as t2).

Also, I referred to "observed" drop or sink several times, when I was describing the actual drop that would occur under the assumed conditions. That wording could be unintentionally misleading. The apparent drop in the image also depends on perspective, as I mentioned later in the post.

Respectfully,
Myriad
 
Last edited:
It is not. Deformation is provable mathematically:

[qimg]http://www.sharpprintinginc.com/911/images/photoalbum/13/sauret_fieldA_060sm.png[/qimg]

Distance b-r does not contract as a rigid body when compared to r-98 or a-b. It contracts too soon, too much.

There are fixed linear relations between tilt and the contraction of a-b, b-r and r-98 over the first 3 degrees if the rotation is rigid. See the link for more details:
http://www.sharpprintinginc.com/911...op=view_page&PAGE_id=176&MMN_position=364:364


The relations might be linear in a strict technical sense, but they are not proportional as you appear to be implying, because of the sine and cosine functions of the tilt angle.

As I showed, the actual drop of the antenna base at one degree of tilt would be expected, for a rigid block, to be about forty times the actual drop of the north wall, which is less than half an inch.

Myriad: "Assume the axis of rotation of the tilt is along the north wall at the 95th floor."

It's not. You can see it is the 98th floor in the west and NE viewpoints.


Doesn't matter. That change only makes the actual drop of the roof line even smaller in relation to the actual drop of the antenna base.

Your not. You are looking about 12 degrees upward. That makes all the difference.


It makes no difference for the actual drop. It does make a difference in the expected apparent drop in the image -- which makes the perspective calculations on your linked pages inaccurate, as we'll see.

Myriad: "Thus we see that at small angles, the expected observed "sink" of the north wall for a small angle of rotation is very small, about half an inch at one degree. And it is much smaller (by a factor of about 40 at one degree!) than the expected observed "sink" of any part of the antenna."

Incorrect. Linear relations between drop and angle are given in the link above.


The relations shown at the link, specifically at http://img404.imageshack.us/img404/4391/sauretrelations.gif, are partially correct -- though awkwardly stated -- sin (90° - tilt) instead of cos (tilt) for instance. The right terms of the second and fourth equations do contain the correct expressions for the actual position in space (height and horizontal distance from the camera) of the rotated points.

However, the overall relationships given handle perspective in a simplistic and inaccurate way, using similar right triangles. What the equations are asserting is:

apparent height of point p / actual horizontal camera distance to the north wall = actual height of point p / actual horizontal camera distance to point p

Which would be reasonable, if the camera were horizontal and at ground level (or perhaps 100 feet above ground level, which seems to be what the values given for c and d are suggesting). But as you just pointed out, the camera is not horizontal so that expression for apparent height is not valid.

This is crucial, because in the change of apparent height of the north roof line with rotation at small angles, the effect of perspective predominates. The actual drop is tiny (being proportional to the cosine of the tilt angle which starts out at a very low slope), less than half an inch. The increase in camera distance due to the wall leaning away from the camera is significantly larger (it varies with the sine of the tilt angle, which starts out at a slope of 1), around three feet. The amount of apparent drop that would be caused by that much increased distance depends on the foreshortening effects of perspective, which depends on (among other things) the camera angle. But it will likely be considerably more than the actual drop.

The very approximate similar-triangles method gives an apparent drop of about eight inches due to perspective (which is about one fifth the apparent drop of the antenna). A more accurate calculation will show a little less than that, and less in proportion to the apparent antenna drop as well, but still well more than the actual drop.

We can get a better (but still rough) estimate directly from the Sauret video, by looking at the "apparent drop" (the vertical image distance from the north wall roof line, using north wall heights as the measure) of the visible southwest corner, before movement begins. It's about 40 feet, and represents 200 feet of increased distance from the camera. So a tilting of the north wall 3 feet away from the camera would produce an apparent drop of 3 * 40/200 = 7 inches.


Incorrect. Here is the NW corner of a model of WTC1 rotating only one degree about the 98th floor seen from the Sauret perspective.

The actual NW corner movement is shown behind it:

[qimg]http://img246.imageshack.us/img246/9973/1degtilt.gif[/qimg]


Very nice. And you can see that they both move vertically by a small amount. The biggest difference is the additional right-left movement because in the real collapse the "hinge" is not perfect.

That's assuming that you've synchronized the images correctly, so that the one degree tilt of the model aligns with the video frame in which one degree tilt has occurred. Since you've claimed that such tilt before drop did not occur at all, I'm not sure how you could have managed that. How does the comparison look if you shift the alignment one or two video frames ahead?

A one degree tilt would be noticable as you can see.


It is.

Even one degree tilt drops the NW corner down more than what is witnessed.


Half an inch, in reality. About seven "apparent" inches in the video.

And guys, thats only one degree. How many degrees do you imagine the north wall tilted before failure?


About one, subject to the usual qualifier that "failure" is not (still not) a precisely defined enough event to specify a point in time with the necessary fraction of a second precision.

Yes, I know, you will now insist that NIST's scenario is utterly dependent on eight degrees of tilt before failure, and "prove" this by showing a graphic by R. Mackey that was intended to illustrate a completely different point, does not show an intact hinge, and does show two floors passing through each other. Go for it, maybe it will be more convincing on the 5th repetition.

All this was included in the links. Did you read them?


Yes I did read them, and no, not everything you think is in the links is actually there. But I was pleased to find that the math on the relations page is as close to correct as it is, though unnecessarily cryptic.

The basic point remains that the actual early downward movement of the antenna due to tilt is an order of magnitude greater (and much more so, in the very earliest stages of tilt prior to about .5°) than the actual downward movement of the roof line. Perspective moderates this difference somewhat for the apparent drop, but even by the calculations in your own links, the apparent antenna drop is at least five times the apparent roof line drop. The movement started at zero and increased in magnitude over time, so any method of detecting movement will detect the antenna movement first, and that is not evidence that the antenna started moving first.

Respectfully,
Myriad
 
Last edited:
Myriad: "The relations might be linear in a strict technical sense, but they are not proportional as you appear to be implying, because of the sine and cosine functions of the tilt angle."

Incorrect. If we establish linearity in all 3 quantities a-b. b-r and r-98, the fact that they are directly proportional is obvious.

Anyone familiar with a Taylor Series? A Mclauren series?

Under small angle approzinmation, a sinusoidal wave can be written as an expanded Taylor series about any point, dropping the second order term and above.. If the point is the origin, this series is callesd a Mclauren series. It is pretty standard practice in physics.

In fact, have you ever tries to solve a 1 degree of freedom equation of motion for a simple pendulum? You will not be able to do that so easily without small angle approximation. If you just write out the F =ma fprm for a simple pendulum and try to solve for theta, you will see exactly what I mean.

You approximate sin(theta)=theta for small angles to solve it.

There are many things in physics which would be much messier without Taylor series expansion.


Myriad: "As I showed, the actual drop of the antenna base at one degree of tilt would be expected, for a rigid block, to be about forty times the actual drop of the north wall, which is less than half an inch."

The model shows you what is really expected. Your equations have no meaning if they deviate from that.

Myriad: "Half an inch, in reality. About seven "apparent" inches in the video."

"Apparent" inches, the drop as it appears from the Sauret perspective is exactly what we want.

Myriad: "About one, subject to the usual qualifier that "failure" is not (still not) a precisely defined enough event to specify a point in time with the necessary fraction of a second precision."

Incorrect. Spotting the obvious transition point when downward acceleration quicly changes from about zero to 0.5 to 1.0 g is another job that Koko can do.

Do you remember in another thread when TFK posted this silly graphic of a step function?

femrwtc7freefall2.png


Original post here: http://www.internationalskeptics.com/forums/showpost.php?p=6448912&postcount=550

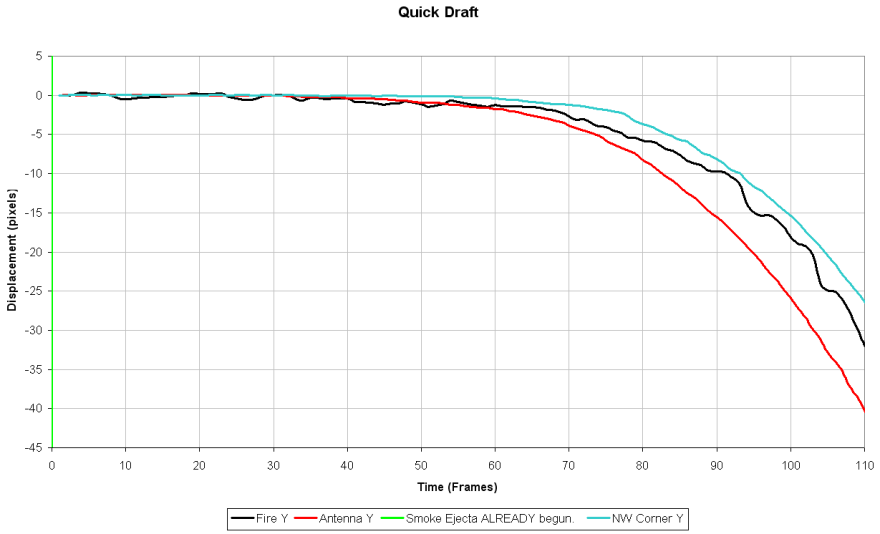
With TFK's step function, can you spot the moment of failure? Koko can be taught to do it, no? Well, using the position and velocity drop curve for the NW corner the moment of failure is just about as obvious.

The transition moment is so obvious I don't know why you keep repeating this.

Myriad: "Yes, I know, you will now insist that NIST's scenario is utterly dependent on eight degrees of tilt before failure, and "prove" this by showing a graphic by R. Mackey that was intended to illustrate a completely different point, does not show an intact hinge, and does show two floors passing through each other. Go for it, maybe it will be more convincing on the 5th repetition."

No, I will make a model consistent with all observables just like I did with the OOS propagation model.

8 degrees is your problem, not mine. It comes up so much because many of you are in denail that you have no collapse initiation model, not even an accurate description.

When we compare my model and yours (NIST's), this will become clear.

Myriad: "Yes I did read them, and no, not everything you think is in the links is actually there. But I was pleased to find that the math on the relations page is as close to correct as it is, though unnecessarily cryptic."

But you didn't understand it if you are still talking about non-linearity in the first 3 degrees of drop. Show me the parts you felt were unnecessarily complicated, and I'll consider rewriting them.

Myriad: "Perspective moderates this difference somewhat for the apparent drop, but even by the calculations in your own links, the apparent antenna drop is at least five times the apparent roof line drop."

Irrelevent. The hardest drop to detect is the NW corner, and the model rotating clearly shows that even 1 degree tilt is clearly visible and detectable.


WD Clinger post 640: "False. Your line r is the roof line, not the base of the antenna. As Myriad's simplified calculations demonstrate, the base of the antenna drops much faster than the roof line. That's why b-r decreases much faster than a-b or r-98."

Obviously. The proportionality constant is not 1. Differential relations between a-b, b-r and r-98 from 0 to 3 degrees here:

rigid_relations2.png


Large: http://img541.imageshack.us/img541/7176/calmesant.png

Obviously b-r decreases much faster. the constants are given in the link in my last post.

Let's look at a-b compared to b-r:

calmesant.png


The point is they are not moving together. It is the relationship between their slopes and curvature. They must slope and curve together to be parts of the same rigid body. As I wrote in the link:

a-b plotted in blue
b-r in pink on the right.

The constraint relations for a rigid body can be rewritten as

d(a-b)/df = c*d(b-r)/df where f is frame and c is a constant. This means the slopes of the blue and yellow lines must remain proportional to one another

and

second derivative of a-b w.r.t. f must equal c* second derivative of b-r w.r.t. f.
Simply stated, it means the curvatures of the two plots must remain proportional to one another.

(just think of f as a variable. Same equations if you use time t.)

>>>>>>>>>>>>>>> the 2 rigid constraints require that:

1) slopes of the two plots must remain fixed to each other (must remain directly proportional)
2) Curvature of the 2 plots must remain fixed to each other (must remain directly proportional)

If the blue and pink curves show rigid motion they have to slope together, curve together, move together, start to fall together.... basically do everything together.

Our two plots obviously, obviously do not move together. They are doing two totally different things. The only common feature between the two plots is they both eventually fall.

When the shapes of the plots of a-b and b-r don't share the same slopes or curvatures the antenna must be moving separately than the perimeter. They cannot be fixed together.

The different shapes of the blue and pink curves is in itself proof of deformity.


I also offered other ways to see roof-line deformity at the link. Did you read them?


WD Clinger: "Myriad didn't say his assumption was perfectly accurate. His assumption was close enough to demonstrate several problems with your approach, including your claim above of a linear relationship between three differences."

Incorrect. I know you are smart enough to expand the sine wave into a Taylor series over a small angle approximation. What are the first 2 terms in a Taylor series? (It's a line) The third term? (curvature)

If you work over a theta domain which is very small you can drop all terms above the linear. Try solving the pendulum problem without that assumption. Pretty standard trick in physics.

WDC: "Major_Tom's claimed linear relationship between a-b, b-r and r-98 is based on his implicit false assumption that the antenna is in line with the wall. "

Incorrect. It is based on small angle approximation.
 
Last edited:
technobabble vs solid geometry, part 1

Anyone familiar with a Taylor Series? A Mclauren series?
Of course. You may also assume we're familiar with the small-angle approximations for sine and cosine. Both are irrelevant here.

WD Clinger post 640: "False. Your line r is the roof line, not the base of the antenna. As Myriad's simplified calculations demonstrate, the base of the antenna would be expected to drop much faster than the roof line. That's why b-r decreases much faster than a-b or r-98."

Obviously. The proportionality constant is not 1.
You're missing the point. They aren't even proportional.

a-b remains roughly proportional to r-98, but b-r doesn't. The problem is that you're using r, the roof line, as a proxy for the base of the antenna. As Myriad and I both demonstrated, the base of the antenna should drop much faster than the roof line. If you need a complete derivation of that fact, we can provide one.

WD Clinger: "Myriad didn't say his assumption was perfectly accurate. His assumption was close enough to demonstrate several problems with your approach, including your claim above of a linear relationship between three differences."

Incorrect. I know you are smart enough to expand the sine wave into a Taylor series over a small angle approximation.
I do indeed know how to do that. I also know it's irrelevant. You're completely missing the point, and you're guessing (incorrectly) that we must not understand some trivial detail of your calculation.

WDC: "Major_Tom's claimed linear relationship between a-b, b-r and r-98 is based on his implicit false assumption that the antenna is in line with the wall. "

Incorrect. It is based on small angle approximation.
Incorrect. Your argument is based upon your incorrect belief that a-b, b-r, and r-98 remain proportional. I may have guessed wrong concerning the root cause of your incorrect belief, but I'm pretty sure your mistake is geometrical.

ETA: Okay, I'll make another guess concerning your root mistake: For the roof line r, the angle is just the tilt angle, so small-angle approximations are valid when talking about r. For the base of the antenna, however, the angle formed between a line drawn to the hinge and vertical is already substantial even before any tilt begins, so small-angle approximations are not valid when talking about the base of the antenna or for a or b.

Second ETA: But that guess is probably wrong. You're using linear approximations, so maybe you're just calculating the derivative incorrectly. Whatever the reason, your "calculated" graph shows a drop of about 1.25 feet for the ball-roof line at 2 degrees. It should be closer to 3.5 feet (3.72-0.15).

Third ETA: Sorry, your "calculated" graph is showing a drop of about 1.25 meters at 2 degrees, not feet. That's not quite so far from 3.5 feet. On the other hand, your ant-ball line has too much slope: your calculated drop is at least 10 centimeters at 2 degrees, when it should be about 2.5 centimeters.

Fourth ETA: Actually, it should be less than 1 cm, because your initial value for ant-ball is about 13.5 meters, less than a third of what I was assuming above. That means your calculated slope is off by an order of magnitude.
 
Last edited:
.............

Incorrect. Your argument is based upon your incorrect belief that a-b, b-r, and r-98 remain proportional. I may have guessed wrong concerning the root cause of your incorrect belief, but I'm pretty sure your mistake is geometrical.


You're not to blame. That is because there are many ways to be wrong but only one way to be right. Which is why it is easy to miss the target but hard to hit it. (Paraphrasing Aristotle )
The problem of being wrong many different ways is universal with the disintegrated, incomplete, conflicting hypotheses of the truthers.
 
WD Clinger post 646: "a-b remains roughly proportional to r-98, but b-r doesn't. The problem is that you're using r, the roof line, as a proxy for the base of the antenna. As Myriad and I both demonstrated, the base of the antenna should drop much faster than the roof line. If you need a complete derivation of that fact, we can provide one."

Please do, show me non-linearity in the quantities a-b, b-r and r-98 relative to tilt over 0 to 3 degrees. From 0 to 3 degrees I approximate sin(theta)=(theta) using a Mclauren series. We can see the effect of stretching the sinusoidal wave over a very small domain here:

horvertmod.gif


If a drops proportionally to tilt over the fist 3 degrees, and b drops proportionally to tilt over the first 3 degrees, and r drops proportionally to tilt over the first 3 degrees....

Then obviously their differences do also.
 
Last edited:
I've posted this graph many times. Please look at the position of the NW corner relative to the antenna drop from frames 130 to 220.

image00029.png


This is all you really need to prove beyond doubt that deformation occurred between antenna and building.

The antenna and NW corner are obviously not moving as two points on an interconnected rigid body.

They must slope and curve together. They do not. This is the b-r shortening you see from frames 130 to 220 in the other graph posted.


Myriad and WDC, just think about it. It is physically impossible that these movements of antenna and NW corner is that of two points on a rigid body.
 
Last edited:
WD Clinger post 640: "False. Your line r is the roof line, not the base of the antenna. As Myriad's simplified calculations demonstrate, the base of the antenna drops much faster than the roof line. That's why b-r decreases much faster than a-b or r-98."

Obviously. The proportionality constant is not 1. Differential relations between a-b, b-r and r-98 from 0 to 3 degrees here:

[qimg]http://www.sharpprintinginc.com/911/images/photoalbum/13/rigid_relations2.png[/qimg]

Large: http://img541.imageshack.us/img541/7176/calmesant.png

Obviously b-r decreases much faster. the constants are given in the link in my last post.

Let's look at a-b compared to b-r:

[qimg]http://img684.imageshack.us/img684/7176/calmesant.png[/qimg]

The point is they are not moving together. It is the relationship between their slopes and curvature. They must slope and curve together to be parts of the same rigid body. As I wrote in the link:

a-b plotted in blue
b-r in pink on the right.

The constraint relations for a rigid body can be rewritten as

d(a-b)/df = c*d(b-r)/df where f is frame and c is a constant. This means the slopes of the blue and yellow lines must remain proportional to one another

and

second derivative of a-b w.r.t. f must equal c* second derivative of b-r w.r.t. f.
Simply stated, it means the curvatures of the two plots must remain proportional to one another.

(just think of f as a variable. Same equations if you use time t.)

>>>>>>>>>>>>>>> the 2 rigid constraints require that:

1) slopes of the two plots must remain fixed to each other (must remain directly proportional)
2) Curvature of the 2 plots must remain fixed to each other (must remain directly proportional)

If the blue and pink curves show rigid motion they have to slope together, curve together, move together, start to fall together.... basically do everything together.

Our two plots obviously, obviously do not move together. They are doing two totally different things. The only common feature between the two plots is they both eventually fall.

When the shapes of the plots of a-b and b-r don't share the same slopes or curvatures the antenna must be moving separately than the perimeter. They cannot be fixed together.

The different shapes of the blue and pink curves is in itself proof of deformity.

You keep saying that those measured plots don't move together but they obviously do maintain the relationship of the calculated rotation plots. Your b-r curves are steeper than your a-b curves as shown in your calculated drop curves and they maintain their relationship, when one curve slopes down faster the other one also slopes down faster. For any reasonable error band your measured plots demonstrate rigid rotation with very little, if any, free antenna movement.
 
I disagree. I'll add a teeny bit of detail in a mo...

I expected so. But I deliberately chose to use the same self assured style you use in your posts. But our disagreement on the placement of T0 in this case is not as big as you might think. But I wanted to make a minor point on timing accuracy.

It's probably a noise source.

I agree, and if that is noise then it is also a possibility that the point at frame 850 also could be noise, since it is within the same level of deviation from the 0-line as the graph is between frame 400 and frame 500. Noise causing a rising deviation could hide the onset of a collapse, likewise a noise causing a downward deviation could give the impression of an earlier collapse onset than really occurred. This will cause uncertainties regarding the exact timing of the movements you and Major_Tom attempt to track, especially minor attempts.

Refraction is a very minor factor in my view. Certainly not a key factor. There are, of course, a multitude of possible noise sources, which are split into two main categories, namely physical trace mechanism accuracy and image noise. Physical mechanism noise is very slight indeed. Video noise has many sources.

Regarding refraction see my next post in response to Major_Tom.

However, as I said, T0 definition is subjective. In the current context, it is the trend of displacement which allows definition of the metric. My placement at frame 850 is based upon access to the full dataset of course, which shows that vertical drop simply continues to increase. The *sharp* increase in drop rate does not recover, and simply increases over time. Frame 850 is about half-way through that initial transition, and is perfectly reasonable.

Where would you place it on the graph ?

The two types of accuracy come into play to answer this question. I'd suggest better than +/- 0.05 px for positional variance, and +/- 0.1 px for effective positional variance.

In fact I tend agree on your placement at frame 850, but it is still within the noise level. If I were conservative I would place it at frame 890, at a time that downward movements can be discerned also in the video. But a placement at frame 850 also coincide with the flare up of the fire at the southeast corner, due to a possible floor collapse leading to increased instability in the south wall and the onset of collapse, so that could very well be the correct placement but we cannot be sure.

My point is that we cannot be sure of the exact timing and that it is better to put on some qualifiers like "probably" or "likely" in connection with your statements instead of overselling them.
 
Norseman post 603: "A keyword here is refraction, it is very evident in the videos, combined with recording artifacts."

In order to understand what resolutions are possible and noise levels, you can use static point comparisons at the following link:

Upper West Wall Pulls Inward 9.5s before Collapse

Light refraction is a well known aspect in photography on hot days, it causes blurring in photos of objects taken at a distance. In videos it will in addition to blurring of the object, it will also cause the object to fluctuate in the video.

Refraction is caused by temperature differences in the air leading to density differences that causes the light to deviate from the straight line between the camera and the object. A couple of links:

In the Etinne-Sauret video of the north side of WTC 1, the hot gases from the fires creates clearly visible distortions that changes over time due to the random nature of gases coming out of the tower. This affects the whole upper part of the tower from floor 92 and up. This comes in addition to the atmospheric distortions.

Just look at the static point, in your link, that you placed on the loose corner plate on the northeast corner of WTC 1. In the video it fluctuates due to hot gases coming out from the burning floors. This will of course affect the accuracy of any measurements you attempt to make.
 
Last edited:
Seems this simplified cross-check method has been lost in the to-n-fro, all the way back on page 10...

http://www.internationalskeptics.com/forums/showpost.php?p=6613090&postcount=371
As there is, and probably will continue to be, doubts about the ability to determine tilt from multi-angle video trace calculations, I'm going to use a different method.

As can be seen in the previous image, tilt of 8º about the North face results in vertical descent of the south-side by over 2 storeys.

More specifically, about 29 ft.


So, we can check the approximate angle by determining how far a feature on/near the SW edge descends before the NW corner releases.

An available feature would seem to be the fire near the SW edge.


Anyone have any issue with this method ?

Of course, the appropriate math can be applied to account for the actual location of the chosen feature on the West face.

dreh.gif

437537321.png


I'd put a reasonable estimate as...the fire is about 2 pixels ahead.

I'll provide detail soon, but for the SW edge 1 pixel ~= 0.8ft, so ~1.6ft...call it 2ft.

< 0.6 degrees, call it ~ 1 degree.

You can also directly compare a southerly feature (the fire) with the northerly feature and the antenna.
 
technobabble vs solid geometry, part 2

WD Clinger post 646: "a-b remains roughly proportional to r-98, but b-r doesn't. The problem is that you're using r, the roof line, as a proxy for the base of the antenna. As Myriad and I both demonstrated, the base of the antenna should drop much faster than the roof line. If you need a complete derivation of that fact, we can provide one."

Please do, show me non-linearity in the quantities a-b, b-r and r-98 relative to tilt over 0 to 3 degrees.
The problem is accuracy, not non-linearity. It looks to me as though the graph you posted previously grossly over-estimates the change in the difference a-b between your top landmark on the antenna and the antenna ball:

drops1.jpg


That miscalculation may have misled you to think that the collapse of the antenna began sooner and was of considerably greater magnitude than it was. It may also have misled you to underestimate the tilt.

To calculate the differences shown in the graph above, I used the following parameters:
  • r0 is Myriad's s1, the height of the upper block from hinge to roof.
  • s2 is Myriad's s2, the lateral offset of the antenna from the edge of the roof.
  • b0 is the height of the ball above the hinge.
  • a0 is the height of Major_Tom's line a above the hinge.
With those parameters, the initial coordinates of relevant landmarks are:

hinge: <0,0>
edge of roof: <0,r0>
base of antenna: <s2, r0>
antenna ball: <s2, b0>
intersection of antenna with Major_Tom's line a: <s2, a0>

With those coordinates, the tilt will be a negative angle; that's just mathematical convention. (To use a positive angle, I'd have had to insert a minus sign in front of each s2 above. For the graph shown above, I made that change so my angles would correspond to Major_Tom's.) Applying the standard rotation matrixWP, rotating by an angle θ transforms the coordinates shown above into

hinge: <0,0>
edge of roof: < - r0 sin θ, r0 cos θ>
base of antenna: < s2 cos θ - r0 sin θ, s2 sin θ + r0 cos θ >
antenna ball: < s2 cos θ - b0 sin θ, s2 sin θ + b0 cos θ >
intersection of antenna with Major_Tom's line a:
< s2 cos θ - a0 sin θ, s2 sin θ + a0 cos θ >

For the graph, I used these values:

  • r0 = 60m
  • s2 = 30m
  • b0 = 74.8m = 60m + Major_Tom's 14.8m
  • a0 = 88.3m = 74.8m + Major_Tom's 13.5m
I let gnuplot do the rest.

From 0 to 3 degrees I approximate sin(theta)=(theta) using a Mclauren series.
A Maclaurin series (note spelling) is just a Taylor series expansion around 0.

For anyone who's tempted to try this at home: The approximation sin θ≈θ works only for small θ, and only when θ is measured in radians.
 
Anyone familiar with a Taylor Series? A Mclauren series?

Under small angle approzinmation, a sinusoidal wave can be written as an expanded Taylor series about any point, dropping the second order term and above.. If the point is the origin, this series is callesd a Mclauren series. It is pretty standard practice in physics.

In fact, have you ever tries to solve a 1 degree of freedom equation of motion for a simple pendulum? You will not be able to do that so easily without small angle approximation. If you just write out the F =ma fprm for a simple pendulum and try to solve for theta, you will see exactly what I mean.

You approximate sin(theta)=theta for small angles to solve it.

There are many things in physics which would be much messier without Taylor series expansion.

Incorrect. I know you are smart enough to expand the sine wave into a Taylor series over a small angle approximation. What are the first 2 terms in a Taylor series? (It's a line) The third term? (curvature)

If you work over a theta domain which is very small you can drop all terms above the linear. Try solving the pendulum problem without that assumption. Pretty standard trick in physics.

Are you trying to impress us with your knowledge of basic physics or basic math?

You are talking to several WORKING engineers and scientists on this site MT.....we are NOT impressed with such things. You aren't talking to kids living in their parents basement...so spare us your attempt at teaching US physics or math. It's pathetic.

You should be humbled that there are several here that are even willing to take the time to wade through your erroneous arguments and attempt to educate you.....I gave up on truthers long ago and simply allow them to have their delusions. It isn't worth my time to even check their math or reasoning because they have such a track record of being wrong and not understanding why even when it is spelled out to them over and over....

Stick around this forum Tom....you might learn something about physics/math.

It's rather obvious you need to.
 
Quote: Basquearch
You have to open one, memorize the pixel location on the antenna, open the subsequent one and see the difference if any.
femr2 Read the thread BasqueArch, you really need to, or better still, read through all the trheads on sub-pixel tracing methods over at the911forum.

I received a friendly PM recommending software that would tie these jpegs together.

I asked for video with the frame numbers on them, like the Sauret antenna drop before NW corner movement. I got hundreds of individual jpegs instead. I Was Being Sarcastic.
 
I received a friendly PM recommending software that would tie these jpegs together.
Tying those particular jpegs together is a given. When I referred to software I was suggesting tools to enable feature tracing. I informed you that I use SynthEyes. A much more primitive (but free) toolset is available with Tracker.

I asked for video with the frame numbers on them, like the Sauret antenna drop before NW corner movement. I got hundreds of individual jpegs instead.
With each image being named with the frame number.

I Was Being Sarcastic.
Doubtful, but I'd certainly hope so, as it would be a pretty darn stupid thing to say otherwise.
 
Those jpegs are called "frames". They are very useful if you know how to use them.


WD Clinger, Thanks for the feedback.

The claim of rigid vs non-rigid is based on the shape of curves, including the one femr posted above. The constants of proportionality won't change that. We have a nice tool to check all results: A model that we can view from all perspectives and take trace measurements on.

It will be a very nice way to put all these these things to the test.

How would the constants of proportionality you suggest change the argument for deformation? Would it? Linear relations still hold over the first few degrees, so points a, b and r must still move according to a set, fixed relation for rigidity to be maintained. They do not move together as multiple drop curves show from at least 2 views.

Above femr shows the antenna movement from the NW view comes before any drop in the SW corner fire. From the NW also it is pretty ovbvious that the antenna, NW corner and SW corner do not move together as a rigid body.

Outside of the a-b and b-r slope, do you have anything else to add? (I'll check the slopes next weekend. I can't do it till then.)


WDC, in your calculation what is the upward angle the viewing line makes with the horizontal? The upward angle of viewing is very important and I don't see it mentioned anywhere in your post. An incorrect upward viewing angle would change the whole result.

WDC post 646: "You're missing the point. They aren't even proportional.

a-b remains roughly proportional to r-98, but b-r doesn't."

If linear relations hold for a small angle, what do you mean by this? How can that be true?
 
Last edited:
WDC, I am looking at your rotational tranformation and I see nothing about the viewer looking up at a 12 degree angle. Where do you include this info in your calculation?

Do you assume the viewer is looking horizontally? I hope not.

Check this out:
http://img541.imageshack.us/img541/7176/calmesant.png

If we use your slope, we get pretty absurd angle readings. You predict about a 15 degree slope by frame 260?

Are you reality-checking your work?

Please plug your slope into the linked plots and try to predict the antenna tilt with it. Your predictions are way outside of reality when compared to real data.
 
Last edited:

Back
Top Bottom