Moderated WTC 1 features list, initiation model / WTC 2 features list, collapse model

Originally Posted by Reactor drone View Post
......

Just for clarity, from frame 750-900 (a period of 5 seconds) the antenna moves downwards by about 2 inches while the spot on the north wall moves up about an inch. That's some precision measuring.


That's because they claim to plot data points at > 1/100th pixel accuracy.

[qimg]http://femr2.ucoz.com/_ph/6/118879224.png[/qimg]

Changed "are able " to "claim."
 
Happy birthday to leftysergeant.

You are over-complicating the issue by not grasping all of what goes on and inventing stuff to explain what you don't understand.
FYI: Arthur Mann denies the reality of gravity:
http://www.internationalskeptics.com/forums/showthread.php?p=6645994#post6645994
http://www.internationalskeptics.com/forums/showthread.php?p=6645710#post6645710

If you wish to persuade Arthur Mann that the collapse of WTC 1 had anything to do with gravity, you'll first have to convince him that gravity has to do with anything. I doubt whether this is the right thread for that, or even the right subforum.
 
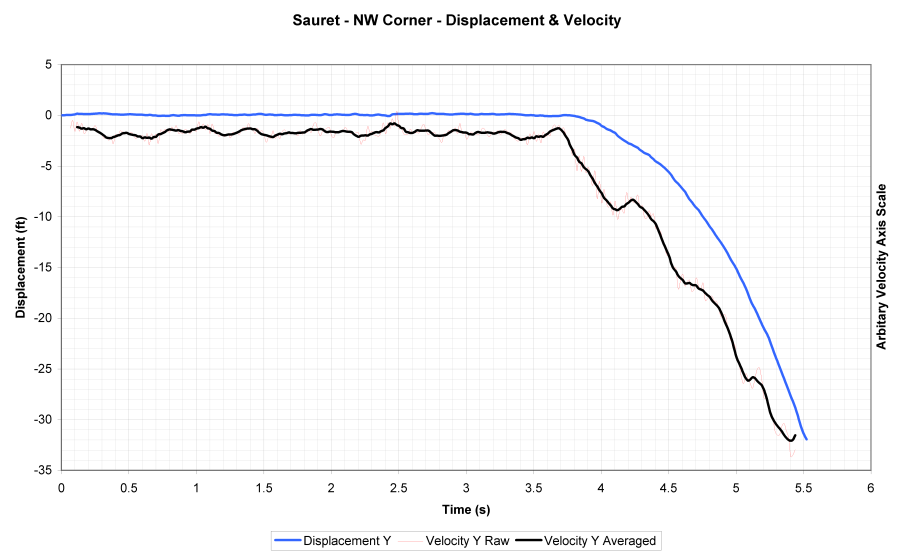
For those of you raising any doubt about the point at which vertical movement of the antenna becomes detectable, I refer you to the following graph...

980386412.png


With this graph you are able to make an informed decision about where you define T0 to be. It is, of course, always a slightly subjective value, but as you can clearly see, the margin is narrow.

My earlier post stating that the antenna began vertical motion at ~ 1:57.2 in the following video...
http://www.youtube.com/watch?v=H_vaYbNZQ5g
...is based upon placing T0 at frame 850 in the graph above.

The specific high quality Sauret footage used has a segment at the beginning of black frames, so frame numbers on the graph are, as indicated, offset by 185 frames.

Anyone wishing to contest the suggested timing will be required to fully justify their complaints in detail.

All details here can, of course, be fully confirmed.

For those of you (no names, BasqueArch) suggesting a timestamp about 3 seconds later, firstly note the sensitivity of the data...it is showing the first pixel of vertical motion, and secondly...any response using methods of poor sensitivity and without data backup will be flatly rejected.

As previously stated, the following animation shows that start point, and the following 3 seconds...
[qimg]http://femr2.ucoz.com/_ph/6/520669917.gif[/qimg]

Suggestion that tilt reaches 8 degrees 2 to 3 seconds after start of antenna vertical motion are clearly nonsense.

Your graph does not support the placement for T0 at frame 850. Look at the deviation of the graph between frame 400 and a bit after 500. Do you believe that the antenna moved up about an inch in that time frame, or could this just be noise? A keyword here is refraction, it is very evident in the videos, combined with recording artifacts. How do you think this could affect the accuracy of your sub pixel tracking?

I would say that BasqueArch is fully justified to place the T0 at the beginning of visible movements. You and Major_Toms claims about invisible movements is not justified by the quality of the source data.
 
If you (or anyone else) want to post graphs, then please label them. Simple. No need to be defensive.
Not defensive, simply stating the origin of the image, having already provided you with the detail you requested.

This is common courtesy. If you are accustomed to posting at a place where people don't label graphs
A slightly odd thing to say. Full axis, content, source video, method, ... details for the graph were included when posted in it's original location...ie context was clear.

then that has apparently reinforced a lack of awareness on your part.
An increasingly silly thing to say...

...especially when I'm filling in your awareness about the origin of an image generated about a year ago, in a totally different arena, but whatever ;)

Label the graphs, please.
Here y'are...
339354536.png


FYI - Making the suggestion *Seriously, have either of you gone to high school?* due to a graph not having labelled axes is pretty gorndarn funny. No High Schools in t' U-of-K, just some rather splendid Universities ;)
 
And so once again, how on earth can you claim significant north wall tilt if the NW corner behaves like this????????

339354536.png


How can anyone not see the transition point where downward motion begins?


Please get geometrical objects like "blocks" and concepts like "hinges" out of your minds,

Please show me any velocity or acceleration characteristics of tilting near the transition point to obvious movement. The position at the first velocity reduction is about a 2 ft drop. This means we can clearly see the beginning of falling through the first few feet of motion.


How can your acceleration change so much, so quickly at the beginning of downward movement if there was a rotational (hinging) phase of motion at the transition point? How can your acceleration take off so much if you are in a tilt phase?

You have everything you need to judge duration of your famous hinge in front of your noses.
 
Last edited:
Your graph does not support the placement for T0 at frame 850.
I disagree. I'll add a teeny bit of detail in a mo...

Look at the deviation of the graph between frame 400 and a bit after 500. Do you believe that the antenna moved up about an inch in that time frame, or could this just be noise?
It's probably a noise source.

A keyword here is refraction, it is very evident in the videos, combined with recording artifacts.
Refraction is a very minor factor in my view. Certainly not a key factor. There are, of course, a multitude of possible noise sources, which are split into two main categories, namely physical trace mechanism accuracy and image noise. Physical mechanism noise is very slight indeed. Video noise has many sources.

However, as I said, T0 definition is subjective. In the current context, it is the trend of displacement which allows definition of the metric. My placement at frame 850 is based upon access to the full dataset of course, which shows that vertical drop simply continues to increase. The *sharp* increase in drop rate does not recover, and simply increases over time. Frame 850 is about half-way through that initial transition, and is perfectly reasonable.

Where would you place it on the graph ?

How do you think this could affect the accuracy of your sub pixel tracking?
The two types of accuracy come into play to answer this question. I'd suggest better than +/- 0.05 px for positional variance, and +/- 0.1 px for effective positional variance.

Again, for definition of the metric in question, it is the trend that is of most significance.

I am in no doubt whatsoever that the curve before the sharp increase in drop rate is a real behaviour.

To dispute my placement, I suggest you will have to justify why that sharp increase, which continues to increase, is not real. It transitions into the more visible multi-pixel movement of course.

I would say that BasqueArch is fully justified to place the T0 at the beginning of visible movements.
BasqueArch suggested a point up to 3 seconds later, which is clearly far too late, and is based on a method which is inferior.

You and Major_Toms claims about invisible movements is not justified by the quality of the source data.
The movement is not *invisible*. You can detect it *with your eyeballs* if you zoom into the image significantly and have a good video scrub function..and know what to look for. Data quality has been justified over-and-over again in numerous threads (including blind-tests using footage with known movements).

One area you may want to look into is the very favourable comparisons with the NIST moire method used to detect sub-inch-level movements of the WTC 7 West wall edge...
89078455.png


As I said, without suitable detail complaints will be pretty flatly rejected by me at least.

I suggest you start performing your own traces using one of the available automated methods for doing so, such that you can gain a greater appreciation of the merit and accuracy of such methods. Generate some data, and by all means go into further detail. I think the femr2 data analysis thread may be a better place for that discussion though, as a good chunk of the learning curve is not the relatively simple process of the actual tracing itself, but pre-trace video handling and post-processing of data.
 
Mangoose, multiple observations linked in the collapse initiation section below confirm north wall and antenna do not move together as parts of a rigid body. The earliest antenna and NW corner movement are detectable about 10 seconds before visible collapse. Please look the information over.


And the video I showed, which is taken from a location that better shows the rotation than the views from the north, shows that the perimeter columns were indeed moving in unison with the antenna. This is from the same moment in time as the other video you posted showing a sagging antenna prior to any failure of columns on the North Face. It is the same moment, just another view.

20101210.gif


Here the NW corner in the upper block is moving in the same direction as the antenna mast and you can see the bulge on the NW corner on the impact floors where the upper block begins. And the movement of the NW corner and the antenna is also accompanied by the downward movement of the fires on the 96th Floor near the SE corner. Looking at these three things together, it is apparent that the upper block is rotating in the direction of the South Face where there was inward bowing. In fact, this video looks very similar to the first degree of rotation of the animation you posted of how it should look if the upper block rotated as a rigid body.

tiltvsvismeasurement.gif
 
Last edited:
Mangoose: "In fact, this video looks very similar to the first 1.0-1.5 degrees of rotation of the animation you posted of how it should look if the upper block rotated as a rigid body."

Yes, it looks similar. Do you know how many features from the following list you would have to ignore to conclude that core and perimeter move together as a rigid body?

Roofline Smoke Pulses just before Collapse
Fire Flair-up along E Face 3s before Collapse
Drift and Drop Movements Traced and Plotted: Summary
Upper West Wall Pulls Inward 9.5s before Collapse
Antenna Base Shifts Eastward 9.5s before Collapse
Antenna Sags 2 ft into Roofline before Falling
Roof Deforms Concavely before Falling
Earliest Ejections are from fl 95, W Face, S Side
Over-pressurization of fl 98 before Falling Begins
Tilt: Upper Portions tilt less than 1 Degree in 0.5s before Falling
West Face: All 60+ Columns W Fail Within 0.5s and 1 Degree
Adjacent Perimeter N and W Walls Fail Within 0.5s Interval
W Wall: Upper Breaks Outward as Large, Unbuckled Pieces
W Wall: Large Piece w/ Straight Break Along Bottom
NW Corner: Upper Slides Over N face and Behind W face
NW Corner: Lower Remains Standing Below Fl 98
NE Corner: Assembly has Straight Break along Bottom
N Wall: Upper Breaks Outward as Large, Unbuckled Pieces
E Wall: Breaks Outward as Large, Unbuckled Pieces
Jolts Detected in Earliest Antenna, NW Corner Drops
Acceleration: Early Downward Rates
88th Fl S Face Light Grey Ejection
77th Fl Over-pressurization Timing Inexplicable


For other posters: Using the graphic above to see what an 8 degree rigid body hinged tilt would actually look like from this angle, can you see how this looks nothing like WTC1?
 
Last edited:
FYI - Making the suggestion *Seriously, have either of you gone to high school?* due to a graph not having labelled axes is pretty gorndarn funny. No High Schools in t' U-of-K, just some rather splendid Universities ;)

If Major_Tom is British, I'll eat my hat. :)

You're welcome for the free advice on how to make your graphs more persuasive.
 
If Major_Tom is British, I'll eat my hat. :)

You're welcome for the free advice on how to make your graphs more persuasive.

They're doing a dry run to repair their scrambled hypothesis before they publish their "big jolt"- like interweb white paper. You should charge them $150/hr to repair what's irreparable.
Your " how are sales going " reply was rofl.
btw, it's interesting how foreigners are peeved by improper English grammar.
There will always be an England - their Magna Carta's civil happiness and Newton's contribution to knowledge are unsurpassed, notwithstanding femr's subtraction from this sum.

http://www.youtube.com/watch?v=Dxn73vXEW7w
 
Last edited:
If Major_Tom is British, I'll eat my hat. :)
If you think that I was laughing at you mentioning whether either MT or myself had been to High School simply because I'm British, that's even more funny.

I'm off for a few days pre-christmas holiday beach duty :)

No pointless spam whilst I'm gone though. I'd hate to have to simply request a split.
 
Some of you may believe that the graphs presented require faith in femr and other reseachers you do not know. This is only because there is nobody stepping up from the debunker side of the argument to reproduce the same measurements from the source video provided.

Actually, much of the measurements can be checked just by carefully comparing any two frames you please. Maybe my biggest challenge in editing the list is in merging simple visual tools with the graphs to help the reader understand that the early drift measurements from 9.5 seconds before the first visible movement seamlessly grow into global deformation which is very visible to us. No faith is required.

Consider the following visual tool: Two frames are alternately flashed in an animated gif to show how different regions of the building are moving relative to each other and relative to static points..

In this first example, we look from the Sauret projection at the whole building above floor 92, flashing between frames 120 and 220 (just over 1.5 sec interval). Remember that the NW corner starts to accelerate downwards around frame 224.

In order to see the degree and direction of local deformation at any point, just hold your pointer still over that point and notice the degree of wiggle.

http://www.sharpprintinginc.com/911_misc/sauret_120-220.gif

Notes:

1) The east corner of the building stays pretty still. The whole portion below floor 98 stays pretty still.
2) The NW corner window washer actually wiggles east-west. Almost no downward displacement, but observable eastward displacement.

nbc-sauret_120-220nwcorner.gif


3) Notice that the whole west corner above floor 98 is being pulled inwards. The pull-in first becomes noticable just above floor 98 and grows much stronger in the top few floors.
4) From this projection, the antenna is moving downwards and hooking to the east. It is as if it is falling and slightly pivoting. It seems as if it's eastward angle increases slightly over this interval.

nbc-sauret_120-220ant.gif


Notice how the antenna fall seems directly related to the pull-in of the window washer on the NW corner. As if the building is being pulled downward from the eastern side of the core, pulling the antenna down with a slight pivot and the NW corner with it.

The outer columns of the building provide an excellent grid that allows us to see how the whole upper west side is being pulled over to the east, but the east side of the building remains still.

>>>>>>>>>>>>>.

This simple visual tool allows you to verify that the tendencies documented in the drop and drift curves shown to you represent very real movement that grows into visible deformations. Movement from as early as Sauret frame 140 is visible to the naked eye.
 
Last edited:
Notice how the antenna fall seems directly related to the pull-in of the window washer on the NW corner. As if the building is being pulled downward from the eastern side of the core, pulling the antenna down with a slight pivot and the NW corner with it.

The outer columns of the building provide an excellent grid that allows us to see how the whole upper west side is being pulled over to the east, but the east side of the building remains still.

It seems more likely that your documenting shifting and local failures within the "hat truss".

Would you agree that the truss system would be under a great deal of stress in directions it was not designed to deal with?
 
Given that this image is a projection (at severe angles) onto two dimensions of movement in three dimensional space, how is vertical downward movement distinguished from movement in the projected image plane caused by tilting (especially away from the camera), lateral translation in the Z direction, and other translations or rotations not parallel to the image plane? It's not an issue of whether or not pixels in the image move, the question is what that pixel movement means in the real three dimensions.

Also, I've been waiting for someone else to say it but: the repeatedly posted animated GIFs of that throbbing antenna are changing my perception of the psychology of the Truth Movement, and not in a good way.

Respectfully,
Myriad
 
Myriad post 615: "Given that this image is a projection (at severe angles) onto two dimensions of movement in three dimensional space, how is vertical downward movement distinguished from movement in the projected image plane caused by tilting (especially away from the camera), lateral translation in the Z direction, and other translations or rotations not parallel to the image plane? It's not an issue of whether or not pixels in the image move, the question is what that pixel movement means in the real three dimensions."

Obviously. Each view is just a 2-D projection of 3-D movement. A person who hasn't totally surrendered to laziness would then record other 2-D projections from other angles over the exact same frames, Sauret frames 120 to 220, and use these projections to reconstruct a 3-D vector.

They would then use this 3-D displacement vector to determine to what degree the antenna is tilting and to what degree it is sinking into the roof-line.


Myriad: "Also, I've been waiting for someone else to say it but: the repeatedly posted animated GIFs of that throbbing antenna are changing my perception of the psychology of the Truth Movement, and not in a good way.

Respectfully,
Myriad "

The 2-D vector projections between any 2 given frames is what you use to reconstruct the original 3-D vector. Myriad, I don't think you have much respect or intelligence. You seem to fake both equally.

Good rebuttal to your post Myriad...have you anything to say, or is your perception of the psychology involved too far gone to accept his statement?
 
Obviously. Each view is just a 2-D projection of 3-D movement. A person who hasn't totally surrendered to laziness would then record other 2-D projections from other angles over the exact same frames, Sauret frames 120 to 220, and use these projections to reconstruct a 3-D vector.

They would then use this 3-D displacement vector to determine to what degree the antenna is tilting and to what degree it is sinking into the roof-line.


Okay, sounds reasonable. And have you done this? If so, is there someplace where you have posted your calculations?

Respectfully,
Myriad
 
Obviously. Each view is just a 2-D projection of 3-D movement. A person who hasn't totally surrendered to laziness would then record other 2-D projections from other angles over the exact same frames, Sauret frames 120 to 220, and use these projections to reconstruct a 3-D vector.

They would then use this 3-D displacement vector to determine to what degree the antenna is tilting and to what degree it is sinking into the roof-line.

Ahhhh, let me see if I understand your current indignation.

a. You clowns have been picking apart these videos for about a year...
b. You've been asserting that the antenna is shifting horizontally & vertically with minimal tilt...
c. a dozen or so people here have been telling you that, in order to verify your assertion, you need to analyze a sequenced alternate oblique view and to calculate true 3D motion...
d. both you & femr have insisted that oblique views are unnecessary, but rather, linear displacements with gross, unsubstantiated assumptions as to the axis of rotation are sufficient...

And now you think that "we are lazy" because we haven't done the correct analysis, the analysis we suggested immediately & you rejected, the analysis you now state is necessary, the analysis that you should have done in the first place.

That about cover it...?
:rolleyes:
 
Last edited:

Back
Top Bottom