The Failure of Science by Pretty Picture
None of these images or movie show any of the 3D structure that you claim to see in white light or G-band images. All 3 of these links demonstrate the 3D structure of a sunspot
below the photosphere, whereas you falsely claim to be able to see 3D structure
above the photosphere, in images that do not carry 3D information. Hence, your claim is an impossible claim to demonstrate with your given images. But I have already demonstrated many times that the 3D structure of sunspots below the photosphere can be reconstructed from the data available, but with lower resolution I suspect, than the supercomputer reconstructions are capable of. For instance ...
Furthermore, we can reconstruct the 3D structure of sunspots from optical data (e.g.,
Westendorp, et al., 1997;
Westendorp, et al., 1998;
Westendorp, et al., 2001a;
Westendorp, et al., 2001b;
Mathew, et al., 2003;
Beck, 2008) and from helioseismology (
Zhao, et al., 2001;
Kosovichev, Duvall & Zhao, 2002;
Zhao, 2006;
Cameron, Gizon & Duvall, 2008;
Gizon, et al., 2009). In all cases, the 3D structure is
consistent with mainstream theory.
The supercomputer models you link to, like the 3D reconstructions I have referenced, are all consistent with mainstream theory, inconsistent with your alternative hypothesis, and notably inconsistent with your claim to be able to see 3D structure
above the photosphere in images that contain insufficient information to support such a claim.
They are still simply white light images of a normal object. There's nothing all that unusual going on in the first place, and it's not as though there are no computer simulations to demonstrate the 3D effect. Even the GBAND image itself shows a series of "down hill flows" along the right hand side that are pretty difficult to miss frankly.
The G-band images do not contain enough information to determine that the flows are "downhill" in the sense of moving downward over surface relief, as in flowing down the side of an elevated sunspot. Rather, you have to
arbitrarily assume that is the case, which is completely circular reasoning, using your arbitrary assumption to prove itself.
Since you have nothing more intellectual to add to the conversation than "wiggly stuff", you are poorly positioned to talk about other people and their "flying stuff". Sheesh.
First we should note that there seems to be little or no visible degradation of that light and the filaments extend into the umbra. The filaments do not become blurry or show any signs of visual degradation. When we reach the ends of the filaments, they wiggle around, we can see them clearly, but they lose continuity at the end of the filament. The filament doesn't extend down into the photosphere, it ends abruptly, and no white light is visible down any sort of "continuous tube" that might be associated with a tubular convection process, where hot and cold plasma streams are right next to each other.
The ends of the filaments certainly "wiggle around" and light up and pick up light into the end of the filament where where it meets up with the dark umbra. I swear, this has to be the single least attentive to detail group of individuals I've ever met. Flying stuff? What flying stuff? White light images? What white light images? Sheesh.
On the contrary, you are the one who pays no attention to detail, while the rest of us are whipping your proverbial rear-end by paying considerably more attention to detail than you do. For instance, you are willing to
arbitrarily assume that the filaments simply "end abruptly" because that's what you
think you see (think you see, but actually do not see). However, those of us who pay more attention to detail than you are willing to do, can clearly see that the filaments do not "end abruptly" (which, given a tiny amount of common sense, is obviously impossible in any case). Rather, the filaments turn away from the line of sight, and extend downwards into the umbra, and material actually convects upwards along the edge of the umbra, up the filaments towards the observer, to initiate the outward flows that are seen in the supercomputer images you linked to (the flows you falsely interpret as "falling" down hill).
Warmer material from below should convect around the magnetically protected area, and that is exactly what we see. Once again, I point out the paper
The velocity field of sunspot penumbrae. I. A global view, and figure 5 of that paper. The penumbra immediately outside the umbra is dominated by blueshifted, upwelling material; it rises to the surface, cools, and then sinks back down again, where the outside of the penumbra is dominated by redshifted, downwelling material.
Consistent with mainstream theory.
We're getting lost now in what should have been a pretty straight forward conversation about the location of the loops and their visible interaction with the photosphere. Each of you seems intent on simply ignoring those Hinode images *entirely*.
Certainly not true, since you yourself always ignore responses of any merit in any case, preferring always to engage in petty insults, rather than attempting to address the merits of your own ideas.
http://solarb.msfc.nasa.gov/movies/xrt_pfi_gband_20061113.mpg
That images shows us the alignment between the coronal loops and the filament pattern
No it does not. There is no substantial correlation between penumbral filaments and coronal loops in this image. In fact, quite the contrary, the obvious interpretation of this image would be that the two are not correlated. After all, if they were correlated, then there should be loops wherever there are filaments, but there are not; the density of the loops should match the density of the filaments, but they do not; and note that most, if not all, of the loop footpoints appear to correlate with the umbra rather than the penumbra of the sunspot. Pay attention to the details of your own images. All you see is some vague, qualitative "alignment", that the loops are more or less where the filaments are, though evidently well above them, and you suddenly think you know it all. But all you know is the illusion you create with your own imagination, certainly not anything substantially related to the details of the image.
http://solar-b.nao.ac.jp/QLmovies/movie_sirius/2010/03/14/FG_CAM20100314150429_174906.mpg
That image shows the effect the base of the filaments when the loops discharge through the filaments.
No it does not. While there are several arguable "discharge events" in the movie,
only one shows an apparent correlation with the base of a penumbral filament. That's not sufficient to claim any real correlation beyond random coincidence. Furthermore, the spatial resolution of the image is so low that one cannot determine how real the one apparent correlation really is. And even if a true correlation were found between penumbral filaments and coronal loop phenomena, the image by itself is insufficient to establish a cause and effect relationship between the two; such a correlation could be caused by a third outside agent, such as the magnetic field, if loop footpoints are found to correlate with penumbral filaments.
http://solarb.msfc.nasa.gov/movies/sakao.mpg
This movie shows the mass flows in the loops that is responsible for the penumbral filament effect we observe in the previous image.
No it does not, but only because there is no penumbral filament effect to begin with. Otherwise, it is a totally unremarkable, ordinary loop movie that proves nothing about anything. There is certainly nothing in this movie which is not completely consistent with mainstream theory, nor is there anything in this movie that would allow us to distinguish between mainstream theory and the Mozina hypotheses.
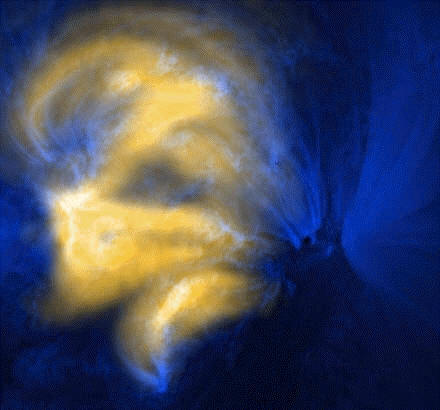
There is simply no way in the universe that LMSAL positioning system is correct. It's visibly incorrect as all the Hinode images demonstrate, not to mention all the TRACE/Yohkoh images that also blow that positioning system away.
[qimg]http://www.thesurfaceofthesun.com/images/mossyohkoh.jpg[/qimg]
The "transition region" is located *UNDER* the photosphere.
Rubbish. To begin with, the images you post blow away your own hypotheses, while the mainstream theory survives quite nicely in the face of everything you try to throw at it. Furthermore, that last YOKOH image, from your own website, clearly shows the transition region sitting well above the photosphere. All of the observations, all of the correctly scientific data,
and all of your own images, clearly show the transition region sitting where it in fact really sits, above the photosphere. Not only are you wrong in every case, you can't even see what's happening in the images that you yourself choose to post. See my earlier post,
The Transition Region, for a point-by-point refutation of the silly notion that the transition region is below the photosphere.
Let us not lose sight of the real issue, the
thermodynamic impossibility of an iron crust or surface on/in the sun:
The constant demand for others to explain these features is just one more in a long list of "red herrings", an attempt to deflect the discussion away from the real issue, namely the impossibility of any iron crust or surface. Mozina simply cannot or will not deal with the central issue, for whatever reason, and that is the central lesson of this entire discussion.
The laws of thermodynamics absolutely refute any notion of an iron crust or surface without question. This is not a matter of opinion, it is a matter of physics. The attentive reader should not let Mozina get away with fobbing off unsupported opinions as if they were anything other than just that. If he cannot produce arguments as detailed and scientifically complete as the science presented in this book, which science he claims to refute, then his arguments must be rejected in their entirety.
Mozina always avoids the central issue of real physics & real science, always falling back on some childish "science by pretty picture" routine, always falling back to the wiggly stuff or the moving lights, but never touching on any truly meaningful topic, never any real science of any kind. He says he will not "bark math on command", but that is just a tactic to hide behind false pride, to avoid the obvious truth that he has no idea how to integrate math & science together. That's why he always sticks to "science by pretty picture". That's the kind of thing we would not fault if it were coming from a child, and might even applaud, by virtue of being a real effort to understand. But coming from someone who claims to have a sophisticated, adult perspective on a scientific topic, it is just plain silly & naive.
Let me repeat the last sentence from the quote above:
If he cannot produce arguments as detailed and scientifically complete as the science presented in this book, which science he claims to refute, then his arguments must be rejected in their entirety. OK, substitute whatever seems appropriate at the moment for "this book", and you get the message.
")