Okay, I've done a fairly in depth analysis of the images that Rramjet sent me, and the following are some of my results and conclusions.
Let's start with the basic position of the object in question, as measured from the images.
There certainly seem to be several changes in direction, but then, we haven't taken the movement of MIR into account, and that's going to be our zero point for this exercise. In order to account for MIR's movement I took measurements from a position on the body of MIR. I had to find a point that remained fairly constant in both size and brightness in all of the images. I chose this point;
If you look at all of the images this particular point remains almost constant. It's also on the body, which means it will suffer less from any effects due to the rotational translation of our view.
So, here's how the position of MIR changes over the period that the object appears on the film.
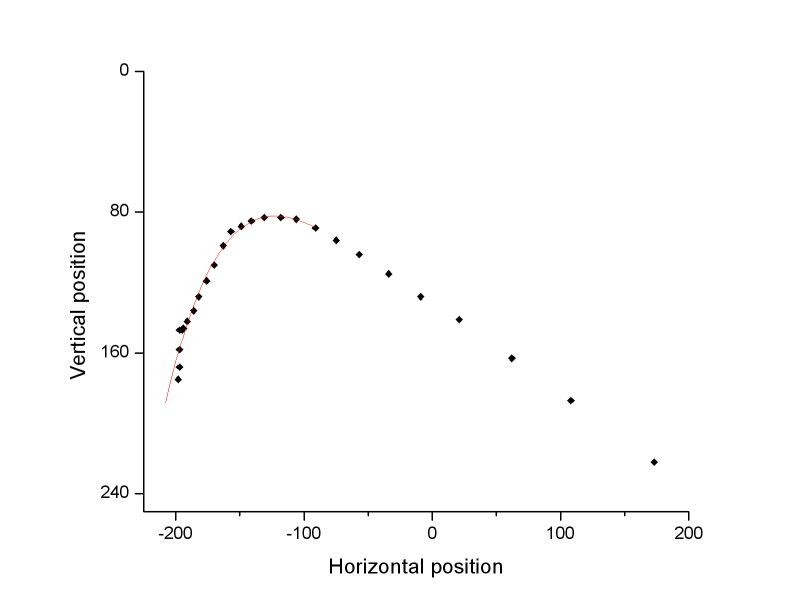
And here's what happens to the position of the object using the position of MIR as a zero point. It also includes a first quick pass at a fit to the curve, in red.
Well, it's not looking great, but it's a lot smoother than the first graph, and I'm nowhere near finished yet.
First off let's try to take the uncertainties of the positional measurements into account, because, as I hope you can see from the graph of MIR's position, there are definitely uncertainties present. So I assumed a 1 pixel error in the measurement of MIR's position, which I think is conservative, but just for the sake of argument and illustration it'll do. I then assumed a 2 pixel error in the measurement of the object's position. This is because there are two factors to consider, firstly the object is not round in all of the images, so it's impossible to define the exact centre, and secondly the pixelation introduces an extra error. That gives us an error of about three pixels in both the horizontal and vertical measurements of the object relative to MIR. As I said, these errors are, in my opinion, conservative, but they serve to illustrate the point.

I've drawn a straight line that passes through the first two points, just to illustrate that the object doesn't travel in a straight line on the first section of it's movement, and I've made a polynomial fit to the more obviously curved section. Now, within the errors, almost all of the points fall onto the polynomial fit to the curve. But let's have a closer look at those sections of the plot where they don't.
On the upper section of the curve only one point doesn't fall on to the fit within the errors, but as I stated earlier, I think the errors are conservative, and it only misses by a whisker. On the lower section, however, there are three points that don't fall on to the fit. This would seem to be a problem for my satellite idea. But hang on a moment, there's more.
As several people have pointed out, Rramjet included, the movement and rotation of the shuttle could also have an effect on the measurements. So let's look at how the aspect of MIR alters with time. The best way to do this is to measure the relative positions of the solar panels.
These are the positions of the tips of the three upper solar panels. As you can see, they don't all move in the same direction, because the relative position are changing due to the shuttle's movement and rotation. But more than this, their paths seem to be curved slightly upwards. So let's take a closer look at each of those in separate horizontal and vertical plots.
This is Panel A, the right most panel.
The red and blue lines are linear and polynomial fits respectively. What we can see from this plot is that for the vertical position graph the linear and polynomial fits are almost identical, but for the horizontal position graph they're different, and the polynomial is a much better fit. It also appears that the curve is more pronounced in the first half of the movement.
Is this the same for the other two solar panels?
Why, yes it is.
So what does this tell us about the apparent motion of the object? Well, to start with it tells us that the movement of the shuttle wasn't constant throughout the film, which will obviously have a knock on effect to the measured position of anything that was recorded, including the object. It also tells us that at some point, probably around the 80 second mark, either the linear speed or rate of rotation (or both) of the shuttle in the horizontal position was altered.
Why is that significant? Because 80 seconds is just before the most deviant points on the positional plot of the object appear.
But it doesn't stop there.
The most deviant points are right at the end of the sequence, when the object is at it's faintest and hardest to measure positionally.
Add to that the fact that the film is grainy due to digital compression, and there are several bits of crap that just appear and disappear on the image, and we can't be certain that what we're looking at is the object in question.
Here's one spurious object.
And another.
And here's our object right next to a third.
In fact there's yet another just to the lower right of those two!
The point of this is that the film is "noisy", making it hard to measure the position with any accuracy, and less than certain that what we're measuring from frame to frame is actually the same object.
So, my conclusions are;
1. That the measured position of the object does fit with the hypothesis that it's a satellite, within the errors.
2. That the position of the object is difficult to measure due to it's brightness, size & shape and the graininess of the film, and importantly it's most difficult to measure at the point where it appears to deviate significantly.
3. That the effects due to the change in the linear and rotational speeds of the shuttle are pretty much impossible to account for.
The final conclusion, and bottom line of my analysis, is that it's impossible to tell what the hell this object is, or even if it's actually the same object throughout, although within the measurement errors it does fit reasonably well with the satellite hypothesis.