• Quick note - the problem with Youtube videos not embedding on the forum appears to have been fixed, thanks to ZiprHead. If you do still see problems let me know.

The physics toolkit

I am asking, "which specific ones did you use in THIS specific analysis?"
I've shown you Tom.

I'm using area based feature tracking, which employs x8 upscaling and Lanczos3 filtering to smooth pixel value transitions. Pattern matching is then employed to provide a best-fit of video data within the search range area for the subsequent frame. SynthEyes also provides a nice handy graph of each sample FOM (The tracker Figure of Merit (FOM) curve measures the amount of difference between the tracker’s reference pattern and what is found in the image. (0..1) 0 being perfect).

No, I'm not getting confused.
Yes, you are. NIST repeatedly state metric accuracies in the order of low inches throughout the Cam#3 analysis.

NiST used moire analysis to enhance their resolution of the lateral movement of WTC7. You haven't discussed that technique in your discussion of the building's collapse.
Probably because I didn't use it. And you seriously then suggest that method will provide only a 6ft accuracy ? Hmmm. Definitely confused :)

It's a source of "lack of confidence" in the baselessly suspicious & paranoid.
Nope. With the full 7 minute video trace I imagine I could detect movement BEFORE that point. Are you keeping up Tom ?

There are 100,000 trivial little details that they didn't specify. Most of them because they analyzed & tossed out, deemed irrelevant or trivial.
Conjecture.

try 40 years worth of noise laden data...
Your recent posts have been a clear example of your lack of experience in dealing with noise levels in real-world data Tom.

You've provided "proof-of-process details"??

That dot & moving circle was your "PROOF of process" for your sub-pixel accuracy claims in the WTC video?

really...?
For the WTC videos ? No, of course not, and stated clearly. It's certainly proof-of-process on the ability to perform sub-pixel accurate tracing of small features within video footage. The effect of the additional sources of noise and error within the available WTC footage is an entirely different thing. Your obsession with extending the scope of presented information is astounding.

You're correct that I haven't extracted my own data from video. No need, IMO. I haven't been the one claiming to do video analysis.
Could you state a claim I've made about the WTC 7 Camera #3 traces please Tom ? :)

Please... Complaining is for drama queens. I haven't been complaining. I've been "commenting".
I refer the less-than-honourable gentleman to my previous response. Exactly what claims are you *commenting* upon eh ?

NIST did not "extract static data points"??
No, they did not.

What do you think that the dots on their "drop distance vs. time" graph were?
Positional markers for MOVING points.

Or do you mean "location of the roof prior to collapse"?
No.

If that is the case, what do you think all that commentary about the horizontal movement of the roof prior to global collapse was about?
Where ARE you going Tom ... ?

Perhaps, rather than my guessing, you should tell me what you mean by "static data points".
Good idea. I've mentioned it many times during this thread, and engaged with a reasonable amount of discussion about it with WDC. Perhaps you skimmed over the thread content to better serve your purposes. Who knows.

Static Points...

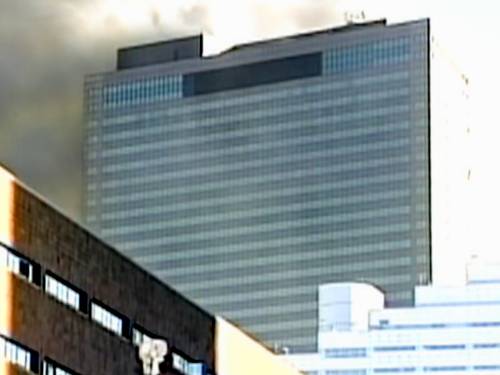
One source of noise within the video is very slight movements of the camera.

By performing traces of multiple points upon the video frame that are guaranteed to remain static (ie features on foreground buildings that are NOT dropping to the ground) it is possible to quantify low-magnitude *camera wobble*.

When I refer to static point extraction, I mean the subtraction of camera wobble data from moving point trace data.

A specific application of this technique was applied to the obvious camera shake of the camera during the Sauret footage with excellent results.

I really do have better things to do than sort out your continual misunderstanding Tom.
 
femr,


I gotta say, guy, that you have an amazing propensity for focusing on, and reacting to, the Fluff, while ignoring the significant. This response is a perfect example.

Allow me to supply my subjective assessment of what is Fluff & what is Substance. And to quote your response.

[My little "wrong way touchdown" video.]
My opinion: Fluff

Your response: You quoted it in its entirety.
___

This is not "venting".
My opinion: Fluff

Your response:
No Tom, it is venting your personal viewpoint of what you perceive to be *the truth movement*, it's viewpoint, it's goals and intentions.

Uh, I think a lot of people here have opinions about the truth movement. And more than one or two have been known to express them. If you're gonna be that thin skinned about that topic, perhaps this isn't the forum for you.

Just a thought.
___

It's stating one of the most fundamental principles of Measurements and Analysis 101.
My opinion: Extreme Substance

Your response:
[silence]
___

[my suggestion that you're a truther.
My opinion: Fluff

Your response:
Unfortunately for me ? What kind of idiot are you Tom ?
Keep your personal crusade out of posts to me.

Even tho it's Fluff, let me ask you for a clear statement of your opinion.

1. Do you consider that OBL & his crew was responsible for 9/11?
2. Do you think that any component of the US gov't was involved in any way?
3. Do you think that NIST or the engineers who supported them committed fraud in any way?
4. Do you consider yourself a truther?
5. If not, how do you distinguish yourself from the rank & file truther?
___

[My statement that your graph supports NIST & undermines the truther perception.
My opinion: Substance

Your response:
[Silence]
___

I've posted THIS for you before.
My opinion: Fluff

Your response:
No, you haven't.

Coulda sworn ...
Ah well, not nice to swear.

OK, if I hadn't, it is an absolutely pivotal, crucial concept for you to learn.
You welcome.
___

[The content of the video] Please watch it.
My opinion: Substance

Your response:
When I have time perhaps.

In other words, no response.

BTW, you're not very good at the convenient little fib. You wouldn't know if you've seen the video before unless you looked at it. Since I set it up to jump right to the pertinent quote, you also saw that quote.
___

[Error analysis] is an acknowledgment of the inescapable fact that there is an inherent error in every single measurement that anybody, anywhere takes.
My opinion: Extreme Substance

Your response:
No excrement Sherlock. Moving on.
___

But you skipped entirely the next, core comment.
And a formal analysis of how much those errors will impact any calculated conclusion.
My opinion: Substance

Your response:
[silence]
___

And now, the heart of my post:

This is an absolutely crucial component of any measurement analysis.

The LACK of an understanding and clear statement of the sources & magnitudes of one's measurement errors is an incompetence.

The LACK of an acknowledgment of those error is a dishonesty.

What I can tell you is this: the single biggest lesson of error analysis is a shocked: "I cannot BELIEVE that, after taking all those measurements so carefully, we've got to acknowledge THIS BIG an error." But that was precisely the message that our instructors were trying to get us to appreciate.
My opinion: Extreme Substance

Your response:
[silence]
___

Then, being the courteous fella that I am, I tried to answer a question that you asked me:
What would you interpret from this animated GIF ?
http://femr2.ucoz.com/NIST_WTC7_redo-newoutsmallhy.gif

I see 100 different things in that gif. You gave me no context, so I answered within the context of the discussion.
I replied:
Are you talking about "what this video says about the continuum vs. discrete process of collapse"?

If that's your topic, the drop of the penthouse says to an experienced structural engineer the same thing that the collapse of the previous (east) penthouse said, and that the subsequent collapse of the north wall confirmed: "the building is in the process of collapsing".

And a careful analysis - like your "east corner" graph confirms that.

And I wrapped it up with a conclusion that tied directly into the discussion.
And there is absolutely nothing that can be seen in this gif to deny that.
My opinion: Substance

Your response seemed a little disproportionate:
Just WHAT is your problem Tom ? Who exactly is denying what exactly ?

Not a word of any Substance. Nothing about what the gif means in the context of our discussion. Just a bit of over-the-top drama.

This has been a continuous pattern in my discussions with you, femr.

Is there some particular reason that you ignore the Substance & fixate on the Fluff?


Tom
 
Tom,

You will recall that the graph you are discussing was presented as a quick and dirty trace of the features.

You then made assertions about what it contained, and I offered you an opportunity provide an interpretation, which you obliged.

I've also stated that it will take me a couple of days to perform the set of requested traces, as it is a very time-consuming and laborious task, involving very careful initial tracker placement followed by much checking, rechecking and analysis of tracker latch quality (which SynthEyes quantifies on a per sample level as I've indicated to you).

I also provided you with a colour processed GIF and asked you to also provide an interpretation of what you can see.

Part of the reason for doing so was to see if you could spot the *problem*.

Before going further, your continual demands for error analysis are becoming incredibly tedious. I have not made any claims about the data I've provided you, and the only person who has made claims about it is yourself, although you have yet to present your reasoning behind this...
My guess, based on measurements that I've made in the past: If you performed a real error analysis, and you used re-interlaced video, you'd find that during the collapse (the time of interest, of course), you've got uncertainties of about ± 2 to ±3 pixels before image enhancements & ±1 to ±2 pixels after image enhancements.
Your guess ?
In the past ?
Re-interlaced video ?
During collapse ? What about your observation re NE corner ?
For data provided to you 2 days ago ?

Right.

You have made claims about the quick and dirty trace provided for the purpose of seeing whether the horizontal point that NIST used to determine their 32.196 ft/s linear fit and their curve fit (which maxes out at 34 ft/s^2) descended slower than my (slow and clean) NW corner traces which (with the most recent distance scalar) max out around 36ft/s^2.

Is there any reason you are not performing your own error analysis for the claims you have made ?

If I do make claims about the WTC 7 trace data, which I publish in any kind of formal way, then it's to be expected that error analysis will be performed. Until that point, Tom, get a grip.

I love how you cherry pick through responses though, deftly ignoring the responses to your misunderstandings, and instead make assumption after assumption upon segments you choose to take out of context or further misunderstandings you have suffered. Boring. Transparent. Far too time consuming. I am not here to discuss error analysis with you. That's your baby. Jog on. Your previous post consists entirely of the assumption that if I don't bow to your whim and discuss what you want me discuss you'll throw your toys out of the cot. It's hilarious. And very sad at the same time.

Now then.

If you look at (analyse) the animated GIF you'll see that the NE corner image quality ain't too hot.

Close inspection reveals that the roofline image data for the NE corner suffers from significant bleed at the start of the clip, which receeds as the clip progresses and the smoke in the background clears. As the smoke clears, the contrast and clarity of the NE corner increases.

Here is a draft trace of the position of the window immediately below the NE corner, and the NW corner...

325296455.png


Your interpretation ? :)

As I've said, I'll get the traces done over the next couple of days (IF you will get off your high-horse and stop being such a time-wasting pompous ass).

If the data is of no use to you, fine. No problem at all. I've plenty to do. The input from W.D. Clinger has been very welcome, and I hope it continues. You are just a drain on scant resources.
 
Last edited:
Tom,

You'd best have the draft horizontal movement traces of the corner features too...
340872750.png


Must've forgot to add the legend, but am sure you can work out which is the NW corner.
 
femr,

This is the only comment that I'll address today.

It's the gem of this post.

Your recent posts have been a clear example of your lack of experience in dealing with noise levels in real-world data Tom.

Psst, femr.

One of the two of us has over 35 years experience as a professional, working engineer.

One of the two of us has written about 400 engineering test reports in his career. Which usually meant "wrote the protocols, designed, built & validated test fixtures & set-up, took the data (or trained & supervised the tech that did), reduced the data, drew the conclusion, wrote the report and signed off with "engineering approval".

One of the two of us has his name in the "designed by" box of something in the neighborhood of 3000 engineering drawings.

... in the "approved by" box of ~12,000.

One of the two of us has seen about 2000 of those drawings turned into real world parts that had to serve a purpose.

One of the two of us has seen about 500 of those drawings turn into parts that went into production & were sold in the marketplace. Either to other high tech companies to stick into their products. Or to hospitals to stick into people.

One of the two of us understands that those drawings have a boatload of dimensions, each with tolerances (i.e., "errors") attached.

One of us understands that, in order to find out what the tolerance (i.e., "error") on all of those numbers on all of those parts must be, a person had to do a competent little error analysis called a "tolerance stack up".

In other words, femr, one of the two of us has been immersed up to his eyeballs, in the real world of real numbers that are dripping with dirt & grime & noise & error.

You were saying something about my "lack of experience in dealing with noise levels in real-world data ..." ?
___

I've got no more time for this nonsense.

WD, he's all yours.

When you find out that this closet truther is laden with charts & graphs & spreadsheets & suspicion ...

... but little understanding of context or significance...

... is immune to logic ...

... publishes page after page after page of posts, but "making no claims"...

... and avoids like the plague stating what he really believes about anything ...

... and when you find out that he'll pick a squabbling fight over trivia when he finds that you disagree with him ...

... when you realize that it's all a waste of time & typing ...

... lemme know.


But this petty little bitch-fest is a pointless waste of time.

In spite of Carlitos' tuning in with a beer. (Nice touch!)


Tom

PS. I'll post the things that I found out about this modeling later this week. They're quite interesting when you put numbers to them.

Unlike femr, when I post them, I will make some claims about what they mean.
 
Last edited:
femr2 said:
Your recent posts have been a clear example of your lack of experience in dealing with noise levels in real-world data Tom.
One of the two of us...(*8)
In other words, femr, one of the two of us has been immersed up to his eyeballs, in the real world of real numbers that are dripping with dirt & grime & noise & error.

That's great. However...

1) When presented with the original set of raw data, this was your response...
tfk said:
I hate to be the bearer of bad news regarding your video data, but...

In short, either:

A. The measured point on that building is undergoing absurd levels of acceleration (10 to 80 G's).
B. I can't program on the fly like I used to.
C. There are some serious artifacts that your video technique is introducing into your data.

I vote "C".
You were deriving acceleration metrics from raw position/time data containing noise, and not treating that noise correctly. Performing first and second order derivations from noisy data using near-adjacent samples will, of course, result in extreme amplification of that noise.

2) Your *smoothing* method...
tfk said:
The dots are from your data points, calculated as a "balanced difference". That is, the velocity is given by (DropPoint[i+1] - DropPoint)/(Time[i+1] - Time). This value is set at the midpoint of the sample times. (= Time + 0.5 dt, where dt = constant for your data = Time[i+1]-Time.)

Extremely narrow band. 59.94 sample per second data, with visible noise level of roughly +/- 0.7ft (+/- 0.2 pixels) (as seen on the following graph provided to you before you even received the raw data)

(click to enlarge)

3) Assignment of blame...
tfk said:
You can immediately see that your velocity data is all over the map. This is a direct result of your very short time base between data points. Even small errors in the measured location will result in huge variations in velocity.
Your velocity data (still cannot see any of your graphs) is all over the map due to your inept treatment of the raw data.
It is not a direct result of my very short time base between data points, but your use of the data.
Yet you clearly understand that small errors in the measured location will result in huge variations in velocity...with your chosen methods.

4) Interpretation...
tfk said:
I strongly believe that this scatter is an artifact of the errors in your measurement technique.
If you had treated the data correctly with regards to noise, you would not end up amplifying that noise.

5) Realisation...
tfk said:
I also believe that the only way to get rid of this is to apply a smoothing filter to the data.
Wonderful. Step number one for anyone with any experience in deriving metrics from noisy data.

6) And backwards steps...
tfk said:
I do NOT believe that those high frequency changes in velocity are real. I believe that they are an artifact of your (camera, compression, analysis technique (i.e., pixellation), etc.

If one accepts them as "real", one has to go to the next step & accept that the building is undergoing completely absurd accelerations.
It would be foolish indeed to accept that the building is undergoing such completely absurd accelerations.

7) Without learning anything...
tfk said:
The acceleration is handled exactly the same as the velocity was.
You'd already realised the need to smooth, then decided not to.

8) And still not realising where the culprit lies...
tfk said:
But now, you can see that you're manipulating velocity data that has huge artifacts built in.
The artifacts in your velocity data are a side-effect of your methods.

9) And still not seeing the fundamental problem...
tfk said:
This makes the calculated acceleration data absurd: over 2500 ft/sec^2 or ~80G's.
The drop distance/time graph presented to you in advance of you receiving the raw data really should have informed you that there was a problem with your method...


10) More interpretation...
tfk said:
I think that I've made it pretty clear that I believe that there is a lot of noise in the data, and that it does not reflect real motions of the building.
From the graphs already presented, the noise variance is roughly +/- 0.7 ft. The full drop height of the building feature spans 340 ft, making the signal to noise ratio roughly 243:1. Not a huge amount of noise in my humble opinion.

Video showing the data overlaid on the source video was provided to clarify good reflection of real building feature motion. (In 2D of course)

11) A voice of reason...
W.D.Clinger said:
I could hardly believe you were criticizing femr2 for providing data that (gasp!) contain noise.

Everyone agrees there's a lot of noise in the data. By definition, the noise does not reflect real motions of the building.

On the other hand, I see no reason to doubt that femr2's data, when analyzed properly, will reflect real motions of the building.
Thanks.

12) The conclusion...
tfk said:
This is good raw data.

You're to be commended for the (clearly extensive) work that you've put into it. You're to be especially commended for your willingness to share your raw data. Something that is exceedingly rare in the truther world.

We have disagreements about several things that overlap into my area: engineering. Especially the recognition & quantification of data errors and their huge effect on the interpretation of data.

The biggest lesson of just a few hours for me on this data is something that is readily evident in your excel data: the fact that very slight variations in the position vs. time model result in sizable variations in the velocity vs. time mode. And then result in enormous variations in the acceleration vs. time model.
(bolding mine)

I have no reason to doubt your engineering skills.
I have no reason to doubt your engineering error analysis skills.

I have good reason to suggest that you are not experienced in deriving velocity and acceleration metrics from position/time data containing noise, regardless of the other areas of experience you have stated.
 
Last edited:
Just for snicks, since Tom K is tuning out for now.

Hi femr2,
Could you please explain how your findings relate to the events of 9/11/01? Do you have a hypothesis that explains the events of that day which:
a) includes your findings
b) conforms to observed events
c) makes sense

Does your hypothesis differ with NIST and the 9/11 Commission in any way?
I provided tfk the raw drop distance/time data for WTC 7 in order for him to extrapolate the full descent time as part of a discussion he was having with Tony.

I am still in the process of extracting the data from video, and have not really performed any analysis of the data, so no findings as yet.

The resultant *discussion* with Tom ensued due to his penchant to debunk/discredit/reject any information provided to him by anyone he classifies as a *twoofer*.

My purpose at this time is to improve the quality of the raw data, and refine the pixel->real world scaling metrics.

There has been observation of over-G acceleration in the data, which is also present within the NIST derivations, but until I have exhausted all possibilities in improvement of the scaling metrics it is not really possible to start making conclusions.
 
That's great. However...

1) When presented with the original set of raw data, this was your response...

You were deriving acceleration metrics from raw position/time data containing noise, and not treating that noise correctly. Performing first and second order derivations from noisy data using near-adjacent samples will, of course, result in extreme amplification of that noise.

2) Your *smoothing* method...

Extremely narrow band. 59.94 sample per second data, with visible noise level of roughly +/- 0.7ft (+/- 0.2 pixels) (as seen on the following graph provided to you before you even received the raw data)
http://femr2.ucoz.com/photo/1-0-445-3http://femr2.ucoz.com/_ph/1/2/172155712.jpg
(click to enlarge)

3) Assignment of blame...

Your velocity data (still cannot see any of your graphs) is all over the map due to your inept treatment of the raw data.
It is not a direct result of my very short time base between data points, but your use of the data.
Yet you clearly understand that small errors in the measured location will result in huge variations in velocity...with your chosen methods.

4) Interpretation...

If you had treated the data correctly with regards to noise, you would not end up amplifying that noise.

5) Realisation...

Wonderful. Step number one for anyone with any experience in deriving metrics from noisy data.

6) And backwards steps...

It would be foolish indeed to accept that the building is undergoing such completely absurd accelerations.

7) Without learning anything...

You'd already realised the need to smooth, then decided not to.

8) And still not realising where the culprit lies...

The artifacts in your velocity data are a side-effect of your methods.

9) And still not seeing the fundamental problem...

The drop distance/time graph presented to you in advance of you receiving the raw data really should have informed you that there was a problem with your method...
http://femr2.ucoz.com/photo/1-0-444-3http://femr2.ucoz.com/_ph/1/2/143855524.jpg

10) More interpretation...

From the graphs already presented, the noise variance is roughly +/- 0.7 ft. The full drop height of the building feature spans 340 ft, making the signal to noise ratio roughly 243:1. Not a huge amount of noise in my humble opinion.

Video showing the data overlaid on the source video was provided to clarify good reflection of real building feature motion. (In 2D of course)

11) A voice of reason...

Thanks.

12) The conclusion...

(bolding mine)

I have no reason to doubt your engineering skills.
I have no reason to doubt your engineering error analysis skills.

I have good reason to suggest that you are not experienced in deriving velocity and acceleration metrics from position/time data containing noise, regardless of the other areas of experience you have stated.


psst... I seem to have forgotten something...

Which one of us was the one claiming to be able to produce raw data points with ±0.2 pixel accuracy ...?

How big would the velocity & acceleration variation have been if your raw data points had really had that level of accuracy?

Do a little math. Or just wait a couple days & I'll do it for you as a portion of the results I'll be preparing.
 
Which one of us was the one claiming to be able to produce raw data points with ±0.2 pixel accuracy ...?
I've estimated the noise variance, based on simple eye-balling of the position-time data during the near-static portion of the trace, sure. If you're inclined to perform further analysis on old data, that's great. I imagine you'll come out with a larger value during descent. Awesome.

Make it clear what data-set you are using though, and I assume you'll actually need the source video to do it properly. I'll dig you out a link later.

just wait a couple days & I'll do it for you as a portion of the results I'll be preparing.
Thanks.
 
error analysis

You were deriving acceleration metrics from raw position/time data containing noise, and not treating that noise correctly. Performing first and second order derivations from noisy data using near-adjacent samples will, of course, result in extreme amplification of that noise.
Well said.

Although the original post of this thread asked how Chandler could possibly derive instantaneous velocity from sampled position data for WTC1 (not WTC7), Chandler was actually drawing an incorrect conclusion about instantaneous acceleration from sampled position data. When sampled position data are used to estimate acceleration, the error is proportional to the error in the sampled position data and also proportional to the square of the sampling rate.

Suppose, for example, that +/-es is the worst-case error in the sampled position data, +/-ev is the worst-case error in the velocities estimated by simple differencing, and +/-ea is the worst-case error in the accelerations estimated by second differencing. Let f be the sampling rate (in Hertz). Then

ev = 2 f es
ea = 2 f ev = 4 f2 es

where the factor of 2 comes from computing the difference of two values with +/-e error: e-(-e)=2e.

Extremely narrow band. 59.94 sample per second data, with visible noise level of roughly +/- 0.7ft (+/- 0.2 pixels) (as seen on the following graph provided to you before you even received the raw data)
[qimg]http://femr2.ucoz.com/_ph/1/2/172155712.jpg[/qimg]
Note that femr2 is not advocating a data analysis based on those characteristics of his data, but is using those characteristics to warn against analyses based directly upon his unsmoothed and unreduced data.

femr2's estimated error of +/- 0.7ft is more realistic than the +/-0.44ft error claimed by MacQueen and Szamboti for their data, before Tony Szamboti found it more useful to claim their error was really more like +/-12ft. Note also that femr2's sampling rate of almost 60 Hz provides much better resolution than the 6 Hz of the MacQueen/Szamboti data or the 5 Hz of the Chandler or Chandler/Szamboti data.

Unfortunately, femr2's improved resolution presents a trap for the unwary:
ea = 4 f2 es = 4(59.94/sec)2(0.7ft) = 10060 ft/s2which is more than 300g.

Your velocity data (still cannot see any of your graphs) is all over the map due to your inept treatment of the raw data.
It is not a direct result of my very short time base between data points, but your use of the data.
Yet you clearly understand that small errors in the measured location will result in huge variations in velocity...with your chosen methods.
Absolutely correct. To obtain meaningful estimates for acceleration, we have to reduce the resolution of femr2's data. That's not a knock on femr2's data; it's just a fact of life for this kind of analysis.

Unfortunately, reducing the resolution also reduces our ability to detect short jolts. That's not a knock on analyses that reduce the resolution; it's just a fact of mathematics. The important thing is to accept the limitations of femr2's data and our analysis, so we don't fall for the Chandler-MacQueen-Szamboti fallacy and related fallacies.

If you had treated the data correctly with regards to noise, you would not end up amplifying that noise.
Yep. (ETA: Not have amplified it so much, anyway.)
 
Last edited:
When sampled position data are used to estimate acceleration, the error is proportional to the error in the sampled position data and also proportional to the square of the sampling rate.

Suppose, for example, that +/-es is the worst-case error in the sampled position data, +/-ev is the worst-case error in the velocities estimated by simple differencing, and +/-ea is the worst-case error in the accelerations estimated by second differencing. Let f be the sampling rate (in Hertz). Then

ev = 2 f es
ea = 2 f ev = 4 f2 es

where the factor of 2 comes from computing the difference of two values with +/-e error: e-(-e)=2e.
A useful example. Thanks.

femr2's estimated error of +/- 0.7ft is more realistic than the +/-0.44ft error claimed by MacQueen and Szamboti for their data
I have an inkling that Tom's analysis will involve additional sources of uncertainty, probably relating to the full signal path between real-world source, through camera hardware to final version digital video file.

To date my eye-balled error estimations are based upon the tracking systems' adherance to the tracked feature, but your opinion on any additional suggested factors would be very welcome.

Yep. (ETA: Not have amplified it so much, anyway.)
Yes, of course. My bad. Cannot eliminate amplification of even residual noise.
 
Tom,

I forgot to post the NIST Camera #3 source video link...

HERE

...which I assume you'll need for your uncertainty analysis.

Am currently tracing some more rendered test footage in order to quantify the FOM difference from the NW corner trace. This should give an indication of the noise in the NIST video compared to the noise inherent in tracing small sub-pixel feature movements. I'll post the results soon, though it will probably be after you post your results.
 
It is so amusing, in some deranged way, to pop in time and time again and see femr the physics fraud constantly babbling like an idiot and getting his uneducated posterior handed to him.

Femr...don't you ever learn? I mean, c'mon, over a year ago you failed to answer numerous 8th grade physics questions correct..I figured the sheer embarrassment of that would send you running...or admitting you are a charlatan.

Guess not

Howdy Carl,

Never thought that I'd be defending femr but ...

There are parts of your comment that (I feel) aren't a fair assessment of what's happening here.

And, since I'm his principle antagonist here, I thought it appropriate to comment.

I happen to think that he's a bit of a putz. (Sometimes more than a bit.) And occasionally I overreact to his putziness a bit. (Sometimes more than a bit.) And some of my over reaction has been, shall we be kind, "intemperate".

I can't speak to the physics. I didn't see your discussion. But I've had a few of my own with him about engineering...

But the raw video data that he gets from his SynthEyes program is very good. For example, it meets the "noise level" that he claims. But that does not translate into an equivalent level of accuracy.

When he is talking about the very specific item of "what his program measures in the videos", I've found him to be usually correct.

Where I think that he goes off-track is when he tries to apply that information to the real world outside of the video.

And, even here, it's not the magnitude of the data or his calculations that we are disagreeing about. But the precision.

So, all told, I think that he is basically right about the video data measurements, wrong about their level of precision and misleading when he attempts to interpret what the numbers mean.

But I don't think that the terms that you used are appropriate when it comes to video analysis.


Tom

PS. As an example of our disagreement, NIST states (accurately) that they can measure CHANGES in horizontal position of certain points on the WTC7 down to (if you accurately read between the lines) about 1" level.

But they can only do that by using the Moire technique. That does NOT mean that they could measure absolute locations of other features in the video to anywhere near that level of precision.

In fact, again reading accurately between their lines, they say that they can identify the width of the building, based on its two vertical edges, only to an accuracy of ±4 pixels. Which translate into basically ±4' (48"). This says that they feel that they can identify a vertical (& presumably horizontal) straight line only to a accuracy of ±2 pixels.

This number makes imminent sense to me & feels right, too.

That's not to say that NIST couldn't have done better. It's clear from their data & analysis, tho, that they didn't need to.
 
But I've had a few of my own with him about engineering...
Really ? When, and about what ?

Where I think that he goes off-track is when he tries to apply that information to the real world outside of the video.
When, and about what ?

And, even here, it's not the magnitude of the data or his calculations that we are disagreeing about. But the precision.
I'll await your uncertainty analysis with interest.

So, all told, I think that he is basically right about the video data measurements, wrong about their level of precision and misleading when he attempts to interpret what the numbers mean.
The only precision I've stated has been fully qualified...adherance to the tracked feature position match, with a being-refined pixel to foot scalar. Any suggestion of being misleading is your own inference.


PS. As an example of our disagreement, NIST states (accurately) that they can measure CHANGES in horizontal position of certain points on the WTC7 down to (if you accurately read between the lines) about 1" level.

But they can only do that by using the Moire technique.
It's a technique very prone to translation error. There is really no sure-fire way to calibrate the method from vertical pixel location to horizontal real-world motion scales.

Their results are easily replicable using *8 Lanczos3 filtering and pattern matching (a quick and dirty trace. can be refined further)...
214635544.png

Other methods have been used to replicate this level of accuracy.

That does NOT mean that they could measure absolute locations of other features in the video to anywhere near that level of precision.
Which is a shame, or a travesty, depending upon how you look at it. The methods I use apply to all traced features. What method did NIST use for the roofline trace ?

In fact, again reading accurately between their lines, they say that they can identify the width of the building, based on its two vertical edges, only to an accuracy of ±4 pixels. Which translate into basically ±4' (48").
I basically agree with that (as they are not using their oddball moire technique to define a more accurate position) so it's +/- 1 pixel for them at each end, but will point out that...
a) I'm not measuring absolute distances. I'm measuring frame-to-frame changes in position, which can be performed much more accurately.
b) Their choice of vertical roofline location (which is not clearly defined) is indeed impossible to determine with much accuracy, as the contrast between roofline and penthouses is so poor. A poor choice of point bearing in mind only one point was checked.
c) You should always use the best pixel to distance metric you have available.
 
Last edited:
Where I think that he goes off-track is when he tries to apply that information to the real world outside of the video.


Tom, I could not say it any better.

The real world escapes him.
 
A full quality trace...
89078455.png


Vertical scaling is a manual fit.

The finer variations are there, as are the sharper peaks...

wsvsv.gif


(NW edge, RGB separated)

Obviously, from this view...
370825048.jpg


Quite why NIST chose to smooth out the clearly present sharp directional changes is unknown, but the tracing methods employed for the rest of the datasets I have provided clearly perform at a level of accuracy similar to the *moire* method used by NIST.

Again, what method did NIST use for the roofline drop trace ?
 

Back
Top Bottom