• Quick note - the problem with Youtube videos not embedding on the forum appears to have been fixed, thanks to ZiprHead. If you do still see problems let me know.

Simple climate change refutation challenge

I think you are making much ado about nothing.

Not really. You made a bogus statement. To the extent you used that bogus statement in support of other statements, you were drawing illogical conclusions.

Will this statement make you happy.

Retracting your prior statement would be satisfactory. I will assume from your post that you are doing just that.

CO2 is a greenhouse gas because it absorbs infrared radiation.

That's part of it. It also needs to pass shorter wavelength radiation (which carbon dioxide does). Sufficient presence in the atmosphere is usually considered in the definition, too.

In general, as its concentration goes up in a system like an atmosphere, in the presence of a source of infrared radiation, the temperature of the system will increase.

This is not part of the definition of greenhouse gas. Also, that pesky "in general" isn't very scientific. What do you mean by it?

Because CO2 is a greenhouse gas.....

...and?
 
Would you care to respond to the points in my post?

Note that these are not "edges of confidence boundaries". These are boundaries with 95% probability of being correct. Any point in the area between the lines has a 95% point of being correct. I am going to go with the points that agree with all other independent studies.

In this case the medieval warm period is cooler than modern times. Specially more recent measurements not included in Loehle's.

No, I don't have anything further to discuss with you.
 
Sorry I'm late to this party. Unfortunately, the link in the first post doesn't work for me, so I can't see the graph I'm supposed to rival. Any chance folks could post a version again?

Also, earlier, Alric posted a graph called co2_data_mlo.png (sorry, new users can't post URLs). This graph doesn't show CO2 versus temperature. It shows "monthly mean mixing ratios" of CO2 versus a long term trend fitted to the Monthly Mean CO2. I think there was some confusion on this point. ref: the NOAA ESRL homepage.
 
You made a bogus statement.
Oh come on. "If CO2 concentration increases, temperature increases" is not a bogus statement. Just because many other factors also affect atmospheric temperature, and the cumulative effect of all those other factors can sometimes cancel out - or even more than cancel out - the effect of an increase in CO2 concentration doesn't make the statement bogus. It shouldn't be necessary to qualify all such statements by adding "all other things being equal" to stop people wilfully misunderstanding them.
 
Last edited:
You can be referring to anything you like. I was referring to a statement you made. You said:


The part in bold is blatantly wrong.

As he said, based on it's physical properties. It's pretty much like saying if you put more blankets on you, your temperature will go up. Of course, the sun could suddenly reduce it's radiation, but that's not likely, or some hitherto unknown factor will emerge that means the blanket has a hole in it, but that 'iris effect' isn't actually known either.
 
I think you are making much ado about nothing. Will this statement make you happy. CO2 is a greenhouse gas because it absorbs infrared radiation. In general, as its concentration goes up in a system like an atmosphere, in the presence of a source of infrared radiation, the temperature of the system will increase.

Because CO2 is a greenhouse gas.....
Sorry, but that wouldn't convince me either. It reads too much like unsupported assertion.
 
You really have no concept of reasoned argument, do you? Your resorting to this pathetic "I hate algore" stuff tells us a lot about your "scepticism".

Nonsense. Just showing who support the ridiculous OP, a certain pathetic individual according to your remarks.
 
Last edited:
I've explained this before. CO2 is a greenhouse gas. If its concentration goes up, temperature must too. Its a physical property of CO2.

Why does this remind me of Franko? This tedious repetition of a syllogism over and over as if the repetition makes the case stronger.

CO2 is a greenhouse gas. If CO2 is increasing in the atmosphere then its temperature will rise. Temperatures are rising therefore CO2 is causing it.

Really?

Here is the science:

CO2 is a greenhouse gas. It is also a minor greenhouse gas. The most important by far is water vapour.

The earth's atmosphere does not act like a greenhouse. Greenhouses warm by suppressing convection (which is how blankets keep us warm in bed). The supposed effect of carbon dioxide is to slightly reduce the radiation of heat back into space. But most of the energy of the atmosphere is convective, not radiative, so it has nothing to do with a supposed "greenhouse effect"

There is no such thing as a global mean temperature that has physical meaning. The global mean temperature is an index rather like the Dow Jones Industrial Average, it reduces all of the complexity of the real system down to a single number, but it has no fundamental basis in theory. There is no physical theory that gives any basis for something called "mean temperature" in a system which is not at or near equilibrium. In fact, my college physics books state that unless the system is at or near thermal equilibrium (and the Maxwell-Boltzmann relation holds) a temperature does not exist!

The witness of ice core records is all one way - temperatures rise and then six to eight centuries later, carbon dioxide and methane levels rise. But they both don't alter the rate of temperature rise in any measureable way and they continue to rise for centuries after the climate has already begun to cool.

The Hockey Stick (Mann, Bradley and Hughes 1999) has been solidly debunked by multiple independent investigators. Unfortunately the zombie statistical nightmare keeps rising from the dead despite all efforts to impale it as the worthless statistical trash that it is. The latest person to revive the Hockey Stick was Al Gore in "An Inconvenient Truth" - despite mentioning the Hockey Stick as having been attacked by climate skeptics, Gore introduced a new reconstruction to support it which he referred to as "Dr Thompson's thermometer" which turned out to be the Hockey Stick in disguise. Circular reasoning? Of course.

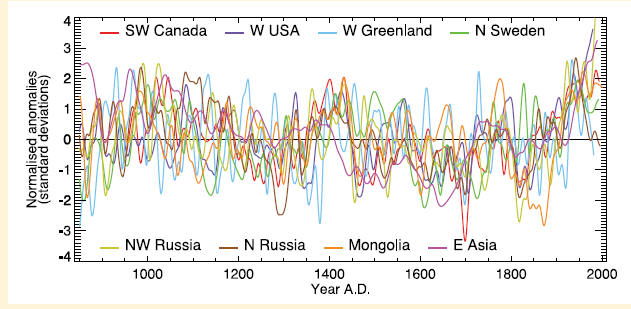
The interesting thing is that all of the other reconstructions of past climate used by the IPCC also suffer from the same catastrophic statistical failures as the Hockey Stick - they are all junk.

[Aside: and even if they weren't just as bad, they debunk the notion that there is a single variable called "global mean temperature"

yang2021.jpg


A single variable called "global mean temperature"? In your dreams]

The warming of the earth from the Little Ice Age began long before carbon dioxide began to rise in the atmosphere, so we're back to chicken and egg scenario - why did the supposed cause follow the effect by at least 150 years?

Finally, I have not met any scientist who doubts that a) climate changes and b) generally speaking over the 20th Century warming has been seen over most of the Earth. The real climate change deniers are those whose false reconstructions of past climate would lead to the belief that natural climate changes over the last 1-2000 years have been trivial compared to the warming of the 20th Century supposedly by man-made greenhouse warming from carbon dioxide.
 
In an attempt to drag this thread back to its premise, is there a succinct graphic "that climate change is not real or associated with phenomena other than C02?" While I can't see the original graphic, it seems an interesting challenge.

Of course, as Diamond points out, that fact that climate changes is widely accepted. I don't know of any "ice age" deniers out there. So I predict nobody will find a graphic that suggest climate change isn't real.

However, it seems to me that there may be graphics that suggest other factors that might be driving things. I would be interested to see folks present them.

That being said, I don't actually think that the truth will necessarily be simple enough to fit in a simple graphic...but it never hurts to look!

After all, we are all interested in sharing ideas and learning, right?
 
Gore introduced a new reconstruction to support it which he referred to as "Dr Thompson's thermometer" which turned out to be the Hockey Stick in disguise. Circular reasoning? Of course.

I don't know. It looks like a hockey stick to me. Even on the graphs used to show "its not a hockey stick". Like this:

yang2021.jpg


gore_a15.gif


Don't you see the abrupt increase in temperature at the end?

On that link they are using a baseline mean temperature in the 1990's!? What makes logical sense is to use a baseline from pre-industrial times.
 
Last edited:
Note that these are not "edges of confidence boundaries". These are boundaries with 95% probability of being correct. Any point in the area between the lines has a 95% point of being correct. I am going to go with the points that agree with all other independent studies.

Huh?

There's a 95% chance that a 95% confidence interval will contain the correct point somewhere inside it. Obviously, not every inside point has individually a 95% chance of being correct, because there are so many of them and only one is the correct one. In general, points near the center of a confidence interval are more likely to be correct than points near the edges.

That's based only on this study, though. Of course, you should take other studies into account too.
 
Sorry, but that wouldn't convince me either. It reads too much like unsupported assertion.

How is it an unsupported assertion when its based on a physical property? Its like you are arguing about whether gold is shiny or copper conducts heat.
 
In general, points near the center of a confidence interval are more likely to be correct than points near the edges.

Consider the data you are analyzing. These are not many data points of single sample to know its average measurement. These are individually correct measures analyzed to obtain a global average. All the measurements are presumed correct on their own. There is no reason to assume the average is more correct than anywhere else within the confidence interval.

Just looking at the overall data it looks like his analysis just expanded the confidence intervals to smooth out the differences and lose resolution. Quite the opposite of what you should do in this type of work.
 
I haven't looked at the study at all. I was just making a general statement about confidence intervals, because what you said sounded funny, as if you didn't understand the concept. If you do know what a confidence interval is, and furthermore you've looked at this study in detail, then you're way ahead of me, so never mind.
 
In an attempt to drag this thread back to its premise, is there a succinct graphic "that climate change is not real or associated with phenomena other than C02?" While I can't see the original graphic, it seems an interesting challenge.

Of course, as Diamond points out, that fact that climate changes is widely accepted. I don't know of any "ice age" deniers out there. So I predict nobody will find a graphic that suggest climate change isn't real.

However, it seems to me that there may be graphics that suggest other factors that might be driving things. I would be interested to see folks present them.

That being said, I don't actually think that the truth will necessarily be simple enough to fit in a simple graphic...but it never hurts to look!

After all, we are all interested in sharing ideas and learning, right?

The OP and Alric asserts that atmospheric temperature change can be shown to be dependent on CO2 concentration based on first principles of physics. Were that so, the IPCC 2007 would be 2 pages long. Not 2000+ pages long....

As it is widely recognized that climate, and temperature, is the product of a very large non linear equation set, the OP is completely erroneous in asserting that it is a linear relationship between Cause "A" and Effect "B". Changing "A" does not make the equation right, it is still incorrect because of its form. Alric apparently refuses to accept this, and thus is in complete opposition to mainstream climate science.

Nonethesless, as you note, numerous graphs and charts over various time scales seem to show (or do in fact show) interesting relationships.
 
The OP and Alric asserts that atmospheric temperature change can be shown to be dependent on CO2 concentration based on first principles of physics

Its really that simple. What is difficult and what the IPCC report and science is about, is seeing through the complexity of climate and answer the simple question.

We all know climate is complex. That does not invalidate that the anthropogenic increase in greenhouse gases is what is causing a recent anomalous increase in global temperature.

You have been repeatedly told you were wrong on this. You cannot argue climate change from first principles of physics based on the behavior of CO2 as a greenhouse gas.
 

Back
Top Bottom