Merged Discussion of femr's video data analysis

However:
Isn't it true that the four methods in the latter graph show:
1) Some movement in the 11-12 sec interval (the two SG methods only - the polynomial ones obviously out of range);
2) Rapid acceleration in the 12-13 second interval(all four);
3) decreasing accelerations after 13 seconds (all four); AND
4) a period in excess of "G" around the 13 second mark? (all four)
It's true that the graphs show that. How reliable are these results with respect to the real thing, I'm not yet convinced. The remarkable differences between 1 pass and 2 pass SG cast doubts about the reliability of the data to start with.


If those four are true is it also true that the arguments over femr2's "accuracy" does not move the bounds of solutions outside those four broad parameters?
No, for the above reason.
 
It's true that the graphs show that. How reliable are these results with respect to the real thing, I'm not yet convinced....
Thanks.

...The remarkable differences between 1 pass and 2 pass SG cast doubts about the reliability of the data to start with...
Within the scope of my questions there are no "remarkable differences" - both of the SG results satisfy the criteria I named.

No, for the above reason.
That assurance doesn't flow from "the above reason". The problem in part due to my phrasing of the question so that we end up with a sort of triple negative construct.

Let me be more direct:
Have you or WDC [done calculations/performed analysis] which supports claims that:

a) There was no movement in the 11-12 second range; OR
b) There was not rapid acceleration in the 12-13 second range; OR
c) That there was no period of "over 'G'"?
 
[size=+1]The Savitzky-Golay Algorithm[/size]

In 1964, Abraham Savitzky and Marcel J E Golay published a paper that began by reviewing a variety of different methods for smoothing and differentiation of time series. They then confined their attention to one particular method (which is now known as the Savitzky-Golay algorithm, even though they didn't invent it), and described their clever technique for implementing that method (which is also known as the Savitzky-Golay algorithm).

To keep those two things straight, I'll refer to the method they implemented as Savitzky-Golay smoothing/differentiation, and I'll refer to their technique for implementing that method as the Savitzky-Golay implementation technique, or as Savitzky-Golay convolution.


[size=+1]Savitzky-Golay Smoothing/Differentiation[/size]

Savitzky-Golay smoothing is one member of the infinite family of smoothing methods that replaces each point of a time series by a smoothed point computed as follows:
  • Select a window (neighborhood) surrounding the point.
  • For some parameterized function (such as a polynomial of degree n), determine the parameters for which the function best fits the points within the window.
  • Using those parameters, calculate the value of the function at the point. That is the smoothed value.
Different methods use different windows, different kinds of parameterized functions, and different notions of best fit.

For each method of that family, the value of the kth derivative at each point can be estimated by computing the value of the kth derivative of the best-fit function at each point.

With Savitzky-Golay smoothing/differentiation:
  • The window is symmetrical about the point to be smoothed, with an odd number of points in the window.
  • The parameterized function is a polynomial of some degree n.
  • The best-fitting polynomial is defined as the one that minimizes the equally weighted sum of squared errors at each point within the window.
Savitzky-Golay smoothing/differentiation is popular because those are often good choices. Polynomials and their derivatives have obvious physical interpretations for position, velocity, and acceleration. Minimization of least squares is a familiar and convenient technique with pleasant mathematical and computational properties.

For many applications, the most questionable choice is the decision to give equal weight to the squared error at each point. Most methods give less weight to the error at points farther away from the center of the window.

Some of the engineers here would understand this better than I, but I am told that giving equal weight to the squared error at each point yields a fairly flat frequency response within a range determined by the width of the window.

On the other hand, this feature of Savitzky-Golay smoothing may give too much influence to outliers or noise at the extremes of a window. It also creates lag when wide windows are used to smooth a time series for position that may have resulted from sudden changes in acceleration.

That could be of concern when analyzing video of building collapses. To find out whether it's a problem, we'd have to understand the purposes of the analysis.


[size=+1]Savitzky-Golay Convolution[/size]

Although weighting the square error at each point equally may be questionable, it allowed Savitzky and Golay to implement the method more efficiently.

Savitzky and Golay noticed that finding the coefficients of the polynomial of degree n that minimizes the sum of squared errors over a window of width w is equivalent to computing n+1 convolutions, each of length w, using convolution coefficients that depend only on n and w.

These convolution coefficients can be computed ahead of time. For an example of how these convolution coefficients are derived, see Wikipedia's current article on numerical smoothing and differentiation.

All desired derivatives at the point can be computed directly from the smoothing polynomial's coefficients. That takes O(n) time for each derivative.

As an alternative, the desired derivatives can be computed via convolutions, with convolution coefficients calculated ahead of time as for the smoothing polynomial. That takes O(w) time for each derivative, so this alternative technique is competitive when windows are small.

The Savitzky-Golay paper contains tables showing the values of these convolution coefficients for windows with up to 25 points, smoothing polynomials of degree up to 6, and derivatives up to the fifth derivative.

Savitzky and Golay also pointed out that these convolutions can be performed using integer arithmetic, followed by just one division for each convolution.

In 1964, that was hugely important. On most machines of that time, floating point arithmetic was several orders of magnitude slower than integer arithmetic.

On modern computers, floating point arithmetic is just about as fast as integer arithmetic, so that advantage of Savitzky-Golay convolution has disappeared.

For small windows, the precomputed convolution coefficients should still make Savitzky-Golay convolution run faster than minimizing the sum of squared errors, especially if you're calculating only the smoothed time series and a couple of derivatives.

As the window size increases, Savitzky-Golay convolution takes longer. Using separate convolutions for each derivative also takes longer, but that implementation technique is optional even if the smoothing polynomial is calculated via Savitzky-Golay convolution.

Minimizing the sum of squared errors might well be faster for large windows, because the sums needed for minimization can be computed in constant time (independent of the window size) as rolling averages sums. In addition, for sufficiently large windows, differentiating and evaluating polynomials will be faster than using Savitzky-Golay convolutions to compute those derivatives.


[size=+1]Simple Implementation of Savitzky-Golay Smoothing/Differentiation[/size]

In 1964, the world's fastest computer was about ten thousand times as slow as the laptop I'm using today.

I implemented Savitzky-Golay smoothing/differentiation by minimizing the sum of squared errors and computing all non-trivial derivatives of the best-fit polynomial. My implementation might run slower than Savitzky-Golay convolution, but it produces exactly the same results (up to roundoff error). My code was able to take advantage of existing libraries for computing best-fit polynomials, and it shouldn't be hard to change my code to support more sophisticated methods that give less weight to errors farther away from the central point.

Excellent post, this is the first time I actually learned something on this Educational Foundation Forum, beneath all the femr-white noise. :D
 
How can one apply this to the WTC7 NW corner? Well, think of the corner of the building like a freight train rather than as a mosquito.

Is this simple enough to understand? The corner of the building is ...like...real big. Real heavy, much inertia.


If anyone shows me acceleration profiles that resemble the trajectory of an insect over a 2 second interval and thinks it applies to WTC7, I know that cannot be real.


The property of high inertia places realistic physical constraints upon the system under study.

This would only be true if the building was a rigid body. The corner of the building is being acted on by the remainder of the building. A freight train will move like an insect if acted on by something like a tidal wave.

Simple enough for you to understand?
 
Within the scope of my questions there are no "remarkable differences" - both of the SG results satisfy the criteria I named.
That's irrelevant. The graphs show so wildly different profiles in that range that one has to cast doubts over the influence of noise in that pre-release movement. I've also taken a look at the acceleration profile from cam #3 which is of higher quality, and found even more reasons to find it questionable. Namely, I see a possibility of camera shake influencing the movement that could have been originated in the EPH failure.


Let me be more direct:
Have you or WDC [done calculations/performed analysis] which supports claims that:

a) There was no movement in the 11-12 second range; OR
b) There was not rapid acceleration in the 12-13 second range; OR
c) That there was no period of "over 'G'"?
a) and c) have a certain degree of support, in that the noise level may ruin that assessment. If in b) you mean rapid jerk, no, I can't deny there's a rapid jerk in that range.
 
The property of high inertia places realistic physical constraints upon the system under study.
While in the horizontal direction you might have a point, in the vertical direction you don't, due to the influence of gravity. The physical constraints are: small, at best, instances of upwards velocity, and small, at best, instances of acceleration greater than gravity.

Independently of mass, loss of support can cause a very quick progression of acceleration from 0 to near g.

Impact or resistance can cause a very quick progression of acceleration from 0 to -X, for a big X (I use minus sign to indicate upwards acceleration). That does depend on mass somewhat but we're talking of structural elements able to hold that mass statically.
 
That's irrelevant....
My question was quite explicit as to its scope. I'm trying to cut through the fog and ambiguities to see if there is strong evidence that those three aspects - early movement - a period of high acceleration and a period in excess of 'G' have been rigorously rebutted. And each of them as separate findings. My purpose being to find the status of those issues as objective fact trimmed of all the emotive "oppose femr at any cost" from multiple posters other than you and possibly WDC. Your work appears to be commendable as I said in an earlier post however all I see so far is definite statements by femr and vague disagreements by others on those three specific points.

There are three available positions which interest me viz:
1) femr is right on those three points - each taken separately;
2) I think femr is wrong one or more of those three points but at this stage I cannot "prove" it; OR
3) I assert that femr is wrong for [these reasons|reasons posted at this link]

And the status I am looking for on either '2)' or '3)' is one or more of these:
A) There was no early movement in the 11-12 sector;
B) There was no period of high acceleration in the range 12-13;
C) There was no period "over 'G'".

At this stage I am not interested in whether femr is wrong in detail with errors which do not take the true findings outside the range of those three points of interest.

The status of the debate being that femr has posted reasoned argument to support those three - it therefore is the default until defeated by better argument. I haven't seen an explicit rebuttal of those three points.

Where those three points fit in relation to a lot of "debunker" arguments is obvious. I am aware that that aspect falls outside of femr's goal of developing accurate measurements.

I comprehend your speculations:
...The graphs show so wildly different profiles in that range that one has to cast doubts over the influence of noise in that pre-release movement. I've also taken a look at the acceleration profile from cam #3 which is of higher quality, and found even more reasons to find it questionable. Namely, I see a possibility of camera shake influencing the movement that could have been originated in the EPH failure.
...and I wish you well in your efforts to do the research yourself.

a) and c) have a certain degree of support, in that the noise level may ruin that assessment. If in b) you mean rapid jerk, no, I can't deny there's a rapid jerk in that range.
My previous comments apply.

Thanks again.
 
Last edited:
There are three available positions which interest me viz:
1) femr is right on those three points - each taken separately;
2) I think femr is wrong one or more of those three points but at this stage I cannot "prove" it; OR
3) I assert that femr is wrong for [these reasons|reasons posted at this link]
4) femr2 has failed to establish a convincing proof of his assertion on at least two of those three points, namely, over g and early movement.

I am inclined to think (4): femr2 can be right or wrong, but his conclusions don't derive from his analysis. So I can't adhere to any of these three positions that interest you, sorry.
 
Last edited:
Let me be more direct:
Have you or WDC [done calculations/performed analysis] which supports claims that:

a) There was no movement in the 11-12 second range; OR
b) There was not rapid acceleration in the 12-13 second range; OR
c) That there was no period of "over 'G'"?
Video analysis of sampled signals cannot possibly provide ironclad support for the negative claims of a) or c).

I'm not sure what you intended to say in claim b). You could have been talking about instantaneous acceleration, average acceleration, or jerk (as pgimeno took it).

I'm with pgimeno on this:

How reliable are these results with respect to the real thing, I'm not yet convinced. The remarkable differences between 1 pass and 2 pass SG cast doubts about the reliability of the data to start with.
One of the remarkable differences he's talking about is seen between 11.2 and 12 seconds. For most of that interval, the SG and iterated SG curves have opposite signs.

When different methods draw opposite conclusions about the direction of acceleration, we're probably looking at artifacts of how those methods are interpreting the data (both signal and noise).

The artifacts possible with Savitzky-Golay differentiation would be well known to experts, but I'm just learning about them. The artifacts possible with iterated SG are more complex, hence harder to understand, and probably haven't been studied anywhere near as thoroughly as the artifacts of SG.

If anyone were seriously interested in this, they'd use a variety of different methods and compare the outputs of those methods on the video data with the outputs of those methods on known inputs that resemble hypotheses of interest.

pgimeno has started to do that:

That's irrelevant. The graphs show so wildly different profiles in that range that one has to cast doubts over the influence of noise in that pre-release movement. I've also taken a look at the acceleration profile from cam #3 which is of higher quality, and found even more reasons to find it questionable. Namely, I see a possibility of camera shake influencing the movement that could have been originated in the EPH failure.


And the status I am looking for on either '2)' or '3)' is one or more of these:
A) There was no early movement in the 11-12 sector;
B) There was no period of high acceleration in the range 12-13;
C) There was no period "over 'G'".
B) is probably false. Savitzky-Golay differentiation tends to underestimate acceleration near the beginning of a period of rapid acceleration, especially with the wide windows needed here to deal with noise. Iterated SG probably underestimates more than standard SG. If you take a known signal with near-instantaneous transition from rest to free fall, and estimate its second derivative using wide windows with SG or iterated SG, you'll get a curve that looks pretty much like the ones you've been looking at.

I'm inclined to doubt A) and C), but I don't know. I may have a more definite opinion after I've used a wider variety of methods and know more about the artifacts to which they're prone. On the other hand, I may have an even less definite opinion, as that is another possible outcome of research.

For C), I'd remind you that the northwest corner was an extremal point of the building face. For moderately rigid bodies in free fall with simultaneous rotation, accelerations over g at corners would not be unusual.
 
While in the horizontal direction you might have a point, in the vertical direction you don't, due to the influence of gravity. The physical constraints are: small, at best, instances of upwards velocity, and small, at best, instances of acceleration greater than gravity.

Independently of mass, loss of support can cause a very quick progression of acceleration from 0 to near g.

Impact or resistance can cause a very quick progression of acceleration from 0 to -X, for a big X (I use minus sign to indicate upwards acceleration). That does depend on mass somewhat but we're talking of structural elements able to hold that mass statically.


As an extreme example, does the acceleration pattern seen in the purple graph seem realistic to you?


sg51.png


For an insect, maybe. For a large, heavy object, no.


Not all output can be considered to be representations of the actual acceleration. One has to experiment in order to move toward the most realistic solutions.
 
As an extreme example, does the acceleration pattern seen in the purple graph seem realistic to you?


[qimg]http://www.cesura17.net/~will/Ephemera/Sept11/Femr2/sg51.png[/qimg]
I've stated why not:

The physical constraints are: small, at best, instances of upwards velocity, and small, at best, instances of acceleration greater than gravity.
The graph shows clearly accelerations that are wildly over g (blue line), therefore no, that graph is not realistic.
 
As an extreme example, does the acceleration pattern seen in the purple graph seem realistic to you?


Yes.

Of course, I've worked with actual accelerometers and raw data recorded by accelerometers, which usually does look like the purple graph (because things that move also tend to shake and vibrate), so I don't have the benefit of vague intuition telling me what such data "should" look like.

Respectfully,
Myriad
 
Yes.

Of course, I've worked with actual accelerometers and raw data recorded by accelerometers, which usually does look like the purple graph (because things that move also tend to shake and vibrate), so I don't have the benefit of vague intuition telling me what such data "should" look like.

Respectfully,
Myriad

I tend to agree with you: Yes, the actual acceleration profile of a precise point on the surface of the NW roof corner - say, a specific radioactively marked molecule - might be that wild, because the material it's sittiing on shakes and vibrates as the building rubles to a violent fall.

It is however, with utmost certainty, NOT the acceleration profile of the purple graph. That is because we can't measure that point with the sort of precision I indicated, and instead each individual measurement is fraught with several errors. The purple line probably is dominated by the random fraction of those errors, not the actual fine movement.
 
That's irrelevant. The graphs show so wildly different profiles in that range that one has to cast doubts over the influence of noise in that pre-release movement.
Isn't femr2's argument that this pre-release movement is different in quality, at least heuristically, from the noise a longer time before release?

Or does this take care of my injection:

I've also taken a look at the acceleration profile from cam #3 which is of higher quality, and found even more reasons to find it questionable. Namely, I see a possibility of camera shake influencing the movement that could have been originated in the EPH failure.
...
Not sure what you mean by "could have been originated in the EPH failure"
 
That's irrelevant. The graphs show so wildly different profiles in that range that one has to cast doubts over the influence of noise in that pre-release movement.
Isn't femr2's argument that this pre-release movement is different in quality, at least heuristically, from the noise a longer time before release?
I'm not sure, as it's hard to follow his posts because he just says "early movement" without restating what he refers to. I know he's done in past but I don't remember exactly and I'm lazy to search. My recollection is that he refers to movement well before the EPH fall, maybe minutes. I haven't looked that early yet.

However, my understanding is that Ozeco was talking about movement just on the verge of the release, because he referred to the SG acceleration profile plots analyzed by WD and myself, which only cover a short range, and as WD put it (which was indeed my point when I said "wildly different profiles in that range" in the quote above):

One of the remarkable differences he's talking about is seen between 11.2 and 12 seconds. For most of that interval, the SG and iterated SG curves have opposite signs.


Not sure what you mean by "could have been originated in the EPH failure"
I mean that the fall (not the failure - my mistake) of the east penthouse (EPH) might have caused enough ground shaking as to shake the camera and cause apparent motion. Actually the whole internal process that was happening inside starting with that failure might.
 
I'm not sure, as it's hard to follow his posts because he just says "early movement" without restating what he refers to. I know he's done in past but I don't remember exactly and I'm lazy to search. My recollection is that he refers to movement well before the EPH fall, maybe minutes. I haven't looked that early yet.

However, my understanding is that Ozeco was talking about movement just on the verge of the release, because he referred to the SG acceleration profile plots analyzed by WD and myself, which only cover a short range, and as WD put it (which was indeed my point when I said "wildly different profiles in that range" in the quote above):
OK
Perhaps femr or oz can fill in our blanks here.

I mean that the fall (not the failure - my mistake) of the east penthouse (EPH) might have caused enough ground shaking as to shake the camera and cause apparent motion. Actually the whole internal process that was happening inside starting with that failure might.
Hmm then I'd expect increasing camera shake as more and more of the building falls - but I don't think that is apparent at all. Didn't femr2 track foreground points as well to account for camera motion?
 
Hmm then I'd expect increasing camera shake as more and more of the building falls - but I don't think that is apparent at all. Didn't femr2 track foreground points as well to account for camera motion?
Yes, but I'm not too sure that that can successfully filter out camera shake, for various reasons, especially when we're dealing with subtle features.

At the risk of introducing more confusion, here's an illustrative graph showing the velocity and acceleration trends from Cam #3.

First of all, a DISCLAIMER: These are most likely NOT velocity or acceleration of the building, but Some Obscure Quantity That PGimeno Mistakenly Calls Velocity/Acceleration (soqtpgmcV / soqtpgmcA). The vertical displacement unit in the trace data used in these graphs is unknown to me. It may well be proportional to pixels without perspective correction. It may even be just pixels, but I doubt it because the range of the position data goes below -800 and I don't think the video has that many pixels.

With that in mind, the data in the graph is: derivative of the raw position data (soqtpgmcV), with units given by the left axis; second derivative of the raw position data (soqtpgmcA), with units using the same axis except the label should be Vertical Units/frame², and a SG-smoothed version of the latter, with poly degree 2 and using 51 points, and zoomed to a scale corresponding to the right axis, which should be labeled also with Vertical Units/frame².

The vertical position data used (not plotted) is taken from http://femr2.ucoz.com/load/trace_data_nist_camera_3_raw/1-1-0-28, worksheet "NW Corner - 1.xls", first tab, column 52nd (extracted with xls2csv, so I don't know what exact column it is, maybe AZ, but I can say for sure it was labeled Y1).

The derivative method used by the program is central differences: http://soft.proindependent.com/doc/manual-en/x1667.html#AEN1882.

Cam3_profiles.png
 
Last edited:
The remarkable differences between 1 pass and 2 pass SG
Remarkable ? Not really. Pretty darn similar in my book.

cast doubts about the reliability of the data to start with.
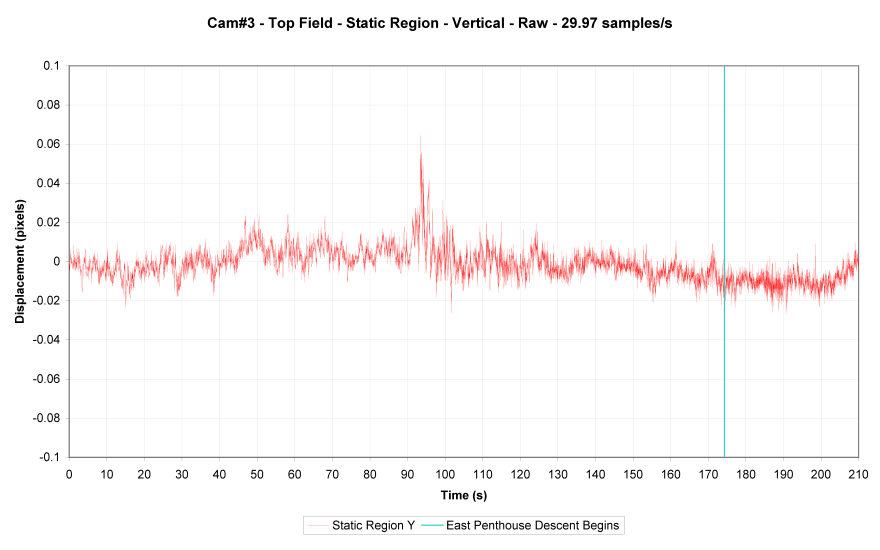
The trace data really is as good as it's possible to extract from the video. The tracing methods themselves are capable of much higher precision. All variance from that is due to the video content itself.

For instance...

904064319.png


Static region trace area can be bigger, increasing effective accuracy...

~+/-0.02 pixel variance.

Ridiculously accurate.

I think I have a zoomed view of the Dan Rather NW corner video with the trace location overlaid...ultimate verification. I'll dig it out, perhaps.
 
I don't see how the last sentence follows from the rest. Also, do you have a point? I fail to see any, especially in relation with what I posted.
Yes, the point is that you used symmetric difference to generate derivatives. SG generated derivatives differentiate the individual polynomial fits. The results differ, and conform to different "rules".

For the record, tfk is not the only one who has called you on the mismatch of your velocity graph and your acceleration graph. Others have done the same; C7 comes to mind as an example.
And both are speaking of "inviolate rules" that don't apply to SG derivatives.

Even I did so myself, and it took me long to understand the reason, and once I understood it I wondered why would you not just provide a velocity graph whose derivative was your acceleration graph, instead of posting a nonsensical velocity graph unrelated to the acceleration one even if being purportedly of the same thing.
It would appear you, like tfk, still do not quite "get" the difference the different derivative methods make...ho hum.

If it was not a deliberate attempt at causing confusion, it was pretty close and certainly had that effect.
See above.
 
The graphs show so wildly different profiles in that range that one has to cast doubts over the influence of noise in that pre-release movement.
Noise certainly has an effect during the "near-release" motion. Close inspection of the displacement data makes that obvious...which is one reason I opted for additional smoothing post-velocity ;)

I've also taken a look at the acceleration profile from cam #3 which is of higher quality
It is indeed...video dependant.

and found even more reasons to find it questionable.
You have all manner of perspective effects during the near-release phase with cam#3 viewpoint. Without accounting for it, it would be "not too clever" to directly compare near-release behaviour.

What may be more questionable is your interpretation of the data, and its limitations.

Namely, I see a possibility of camera shake influencing the movement that could have been originated in the EPH failure.
Camera motion is very-nearly-almost-entirely eliminated.

See fidelity of static region trace above.
 

ISF - Join now!

Every member here is approved by hand. No bots, no spam, just people who care about evidence and honest debate.

Membership is free!

Create your free account

Back
Top Bottom