Bjarne on: Dark Energy, only an illusion.

Status
Not open for further replies.
Bjarne, what your graph shows is the difference in gravity between each floor. It's pretty much flat, apart from some bumps which are to be expected from simple measurement errors. All that demonstrates is that the gravitational gradient is constant. That's exactly what is expected from Newtonian Gravitational theory. Without knowing the ground level gravitational force before the building was erected there's no way to find the centre of gravity of the building.

You have proven nothing.
 
Bjarne, what your graph shows is the difference in gravity between each floor. It's pretty much flat, apart from some bumps which are to be expected from simple measurement errors.
Excactly
All that demonstrates is that the gravitational gradient is constant.
No, opposite, it demonstrate the buildings ADG

That's exactly what is expected from Newtonian Gravitational theory.
No
According to the thesis the buildings ADG "should" show a patterns shown by the red line > http://www.science27.com/forum/reality.jpg

Without knowing the ground level gravitational force before the building was erected there's no way to find the centre of gravity of the building.
That's not true; - the free air gradient can still be used to insulate the buildings ADG values.
You can still distinguish which ADG contribution is which, and what we should expect.
You have proven nothing.
You have understood nothing.
The prevailing thesis doesn’t give the slightest indication proving that the claimed “pattern” is true. It has instead completely failed to be “reproduced” by objective measurement.


************** ************** **************
It doesn't matter how beautiful your theory is, it doesn't matter how smart you are. If it doesn't agree with experiment, it's wrong. ...
Richard P. Feynman
************** ************** **************
 
According to the thesis the buildings ADG "should" show a patterns shown by the red line > http://www.science27.com/forum/reality.jpg

No, those lines are not comparable. Your curve plots the difference between individual floors. The red line is the total gravity from the building depending on position.

That's not true; - the free air gradient can still be used to insulate the buildings ADG values.

You can deduct the gravity gradient within the building (that is what I have done, see the list in an earlier post), but you are not able find its absolute postion, because you have to deduct Earth's gravity from the values, and you don't know the exact value of that, in that particular spot. Therefore you cannot see where it crosses the Zero line, and you cannot determine the COG of the building.

If you really don't understand this, post your exact calculation of the specific gravity of any single floor, and I shall show you where you go wrong.

Hans
 
Bjarne, what your graph shows is the difference in gravity between each floor. It's pretty much flat, apart from some bumps which are to be expected from simple measurement errors. All that demonstrates is that the gravitational gradient is constant. That's exactly what is expected from Newtonian Gravitational theory. Without knowing the ground level gravitational force before the building was erected there's no way to find the centre of gravity of the building.

You have proven nothing.
The plot of the differential gravity inside the building should actually not be perfectly flat. It will be an interaction between the square rule and the distribution of mass around each station, but such non-linearity will be drowned by the relatively high noise (bumps) in the data. Also, the mass distribution in the building will be anything but linear, so you are right: Bjarne's plot proves absolutely nothing.

Hans
 
Bjarne
According to the thesis the buildings ADG "should" show a patterns shown by the red line > http://www.science27.com/forum/reality.jpg
Hans
No, those lines are not comparable.
Make you own graph, to express what you mean.
So far it is only words without concrete meaning.

Your curve plots the difference between individual floors.
It will not be much difference if I compare with the total free air gradient each time. This will be done when the final report is ready.

The red line is the total gravity from the building depending on position.
And this red line express what we “should” expect, (according to the prevailing creeds) - there is not even a shadows of objective measurement that supports that idea.

You can deduct the gravity gradient within the building
Deducting the total free air gradient each time will not change the picture a lot.

(that is what I have done, see the list in an earlier post),
And this shows (according to RC that the buildings ADG is 1.345 mGal >> Completely NONSENS >> http://www.internationalskeptics.com/forums/showpost.php?p=6081872&postcount=1133 to claim such.
Do you think the thickness of the floors is 1.5 meter thick ?

but you are not able find its absolute postion, because you have to deduct Earth's gravity from the values, and you don't know the exact value of that, in that particular spot. Therefore you cannot see where it crosses the Zero line, and you cannot determine the COG of the building.
Still is obvious even for a blind cow that the claimed pattern >> + 0.100mGal in the top and (minus) -0.100mGal in the bottom: is science fiction. It does NOT exist except in people’s fantasy.

You “should” (according to calculation we all agrees) have a variation of TOTAL 0.200mGal YOU HAVE NOT – BUT ONLY TOTAL 0.50 mGal, and it does NOT show the +/- pattern you , RC and everybody else believe in.

There are simply NOT “SPACE” FOR SUCH BIG VARITAION, AS WELL NOT FOR THE CLAIMED PATTERN, - DOESN’T MATTER WHAT YOU DO, - BELIEVE OR EXPECT.

The plot of the differential gravity inside the building should actually not be perfectly flat.
Right, according to the prevailing creeds: it “should not” be flat.
But it seems that this is the only way we can read it, which also was the way Wollery spontaneously have seen it >> http://www.internationalskeptics.com/forums/showpost.php?p=6083919&postcount=1141

It will be an interaction between the square rule and the distribution of mass around each station, but such non-linearity will be drowned by the relatively high noise (bumps) in the data. Also, the mass distribution in the building will be anything but linear,
Locally the building is not homogeneous, but from a overall perspective it is very symmetric (on the 27 upper floors) , - So you have both local effects as well as a overall effect that should not give many surprises. None of these gives larges "bumps"...

so you are right: Bjarne's plot proves absolutely nothing.

First at all face fact. It is CLEAR the prevailing speculation "thesis" is DEAD.

Next....
Yes my theory is "now "only" proven 50%, - since you have a stable ADG (not decreasing ADG) towards the gravitational center of that building, as for example predicted here

I also WILL prove the negative ADG effect due to the mass below (underground) as well also is involved / effected.

A homogenous mass experiment will also give much less “bumps”.

I am not making the rules; I am trying to understand those. Many others are satisfied with a half wind.

Face the simple fact that the scientific methods has spoken and must continue to do so.

 
No, opposite, it demonstrate the buildings ADG
No, opposite, it demonstrate the buildings ADG difference betwen floors

No
According to the thesis the buildings ADG "should" show a patterns shown by the red line > http://www.science27.com/forum/reality.jpg
No.
You have draw a red line displaying your ignorance of physics and inability to do simple mathematics:
35000000 * 6,67E-11 / 50^2 = 0.100 MicroGal.
which is wrong (it is actually 0.9338 microGal).

Then Bjarne does the incompetent act of comparing the ADG from a spherical building (mass 35000000 kg, radius 50 meters) to the ADG measured at the side of a rectangular building :jaw-dropp!
It has instead completely failed to be “reproduced” by objective measurement.

************** ************** **************
It doesn't matter how beautiful your theory is, it doesn't matter how smart you are. If it doesn't agree with experiment, it's wrong. ...
Richard P. Feynman
************** ************** **************
That is really, really stupid.
Newtonian gravity has completely succeeded to be reproduced by objective measurement for over 300 years (with a tweak from GR in the last century).

************** ************** **************
It doesn't matter how beautiful your theory is, it doesn't matter how smart you are. If it doesn't agree with experiment, it's wrong. ...
Richard P. Feynman
************** ************** **************

Bjarne really ugly theory supported only by his pretty pictures and unsupported assertions has been disproved by experiment:
  1. The proper derivation of the force using the proper mathematics shows that the force varies as the radius. It is zero as you would expect at the center where all of the forces balance.
  2. The forces balance at the center of the sphere balance out so the force has to be zero. His idea could have the force as constant for any radius within the sphere. But if it is zero and constant at the core then it must be zero just below the surface and then suddenly increase to the proper value at the surface of a sphere, e.g. giving an acceleration of 9.8 m/s^2 for the Earth.
    1. Discontinuities are not favored by nature.
    2. Miners under the Earth do not suddenly become weightless.
    3. Water is not weightless under the ocean surface.
    4. Submariners do not float in midair.
    5. Tourists descending into the Grand Canyon do not float in midair.
  3. It has been experimentally shown that the force of gravity acts as expected (Test of Newton's inverse-square law in the Greenland ice cap) as Bjarne was told in October 2009 in another thread (The force of gravity is not constant within a sphere).
 
Make you own graph, to express what you mean.
So far it is only words without concrete meaning.

I have supplied the numbers. Make the graph yourself.

Still is obvious even for a blind cow that the claimed pattern >> + 0.100mGal in the top and (minus) -0.100mGal in the bottom: is science fiction. It does NOT exist except in people’s fantasy.

If you make a graph from my numbers, you will find that it fills the range of approximately 0.2.

You “should” (according to calculation we all agrees) have a variation of TOTAL 0.200mGal YOU HAVE NOT – BUT ONLY TOTAL 0.50 mGal, and it does NOT show the +/- pattern you , RC and everybody else believe in.

What do you mean 'only 0.50'? That is a LARGER number than 0.200 (don't tell me you didn't know that :eek: ), which could be because the mass of the building is underestimated.
I have told you before and you MUST be able to grasp that we cannot establish a baseline. Therfore, we cannot see where it crosses zero. There is simply no way to know, with the present data.

Hans
 
This is mostly for a bit of practise and fun, since I know Bjarne won't pay attention, but here goes...

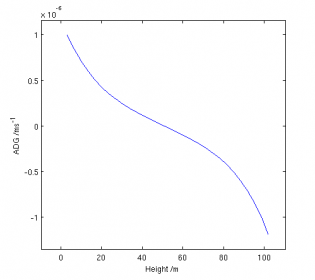
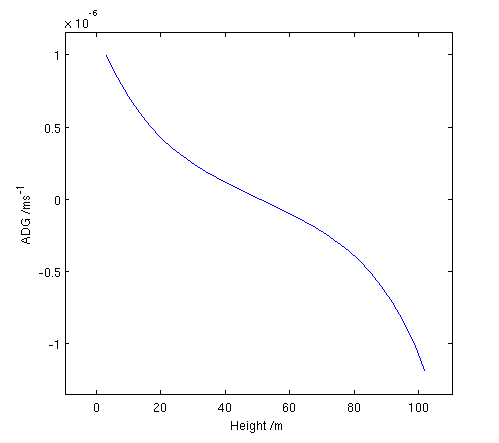
I've had a go at calculating the ADG we'd expect to measure inside Domus Vista by modelling it as a cylindrical building and including the effects of all 30 floors and the walls. Since I've no idea about the elevation and local geology, it's just a model of the building in space.

Here are the results:


That's a pretty tiny field, so the variation will probably get drowned out by other effects.

If anyone wants to run the code themselves, here's the Matlab script. If you spot a mistake (which isn't unlikely!), do let me know.


Code:
R = 20; %Building radius
H = 102; %Building height
nf = 30; %Number of floors
d = 0.01; %Height of meter above floor
pi = 3.141592653;
G = 6.67e-11;
t = 0.2; %Floor thickness
w = 0.2; %Wall thickness
rhof = 2500; %Floor density
rhow = 2500; %Wall density

h = H/nf*(1:nf);

g_floor_above = -2*pi*G*rhof*t*(1-(h+d)./sqrt((h+d).^2+R^2));
g_floor_below = -2*pi*G*rhof*t*(1-(h-d)./sqrt((h-d).^2+R^2));
g_wall = +2*pi*R*G*rhow*w*(1./sqrt(R^2+h.^2)-1./sqrt(R^2+(H-h).^2));

g_floor_total = zeros(1,nf);
for i = 1:nf,
    for j = 1:nf,
        if (j<=i) 
            g_floor_total(i) = g_floor_total(i)+g_floor_below(abs(j-i)+1);
        else
            g_floor_total(i) = g_floor_total(i)-g_floor_above(abs(j-i));
        end
    end
end

g_building = g_floor_total+g_wall;

plot(h,g_building)
 
Last edited:
This is mostly for a bit of practise and fun, since I know Bjarne won't pay attention, but here goes...

I've had a go at calculating the ADG we'd expect to measure inside Domus Vista by modelling it as a cylindrical building and including the effects of all 30 floors and the walls. Since I've no idea about the elevation and local geology, it's just a model of the building in space.

That's cool! So as I expected, the non-linearity will not show above the noise. Actually, my curve (of course I made a curve, but I'll be damn if I do Bjarne's work for him ;) ) is pretty much linear, but makes a rather sharp reverse for the lower three floors. Since the building is very likely to be less dense towards the top (as opposed to Bjarne :D ), this will tend to straighten out the top part. The bottom 2-3 floors go down into a shopping center covering at least twice the area of the tall building, so there, all bets are essentially off.
Local elevation is 15-20 meters, and the geology is ice-age sediments over chalk cliffs with a very deep granite bedrock.

Hans
 
which is wrong (it is actually 0.9338 microGal).
Completely Crap
35.000.000 * 6.67E-11 /50^2 = 0.000000934 m/s2Or……………………………………………………….. 93.4 MicroGal
Or……………………………………………………….. 0.0934 mGal

And this fits almost exactly what the graph below (made by ArcturusA)
365534c2ca9f73c9d5.png

(Except I do not understand why he has found (minus) 0.120 microgal at the bottom and (plus) 100 microgal in the top).
(This is 20 microgal to much at the bottom.) ( I assume this is a "drawing error") - So the graph is all right .

As you can see the buildings own gravity MUST vary with +/- 100 MicroGal - (200MicroGal) - This is NOT what is found measured. - Hence the exsisting thesis is DISPROVEN

That is really, really stupid.
Newtonian gravity has completely succeeded to be reproduced by objective measurement for over 300 years (with a tweak from GR in the last century).
This is a really , really , really , really , really stupid , stupid statement, - because central gravity is nothing but creeds, never proven, and never systematical measured, before now.

I have supplied the numbers. Make the graph yourself.
It’s just a joke.
You and RC have supplied a really , really , realy , stupid, stupid, idea that means that the concrete floors at DOMUS VISTA must about 1,5 meter thick (since RC claims the buildings own gravity is 1300% more that a 10 years old child easy can calculate it to) http://www.internationalskeptics.com/forums/showpost.php?p=6081872&postcount=1133

I believe you agree to that stupid, , stupid idea. (But we never know)
But All right, - I mean 1½ meter concrete floors and walls could be the case for RC’s special anti crackpot build apartment, - but such is not normal on Frederiksberg.

If you make a graph from my numbers, you will find that it fills the range of approximately 0.2.
0.2 cows or what ?

Except the normal blablabablablabal there is nothing new under the Sun today.
 
Last edited:
Local elevation is 15-20 meters, and the geology is ice-age sediments over chalk cliffs with a very deep granite bedrock.

Hans

I was mostly asking to see if there's a way to know what the ADG of Earth would be there without the building, so it was kind of tongue in cheek. But then I saw this:

http://news.bbc.co.uk/1/hi/sci/tech/8767763.stm

Seems it's quite had to find the data though, the ESA site is a maze.

(Except I do not understand why he has found (minus) 0.120 microgal at the bottom and (plus) 100 microgal in the top).
(This is 20 microgal to much at the bottom.) ( I assume this is a "drawing error") - So the graph is all right .

The asymmetry is caused by two things:
-The meter is slightly elevated off each floor
-I don't think I included the roof
 
The point and "problem" is so far I understand that RC and Hans (ect....) don’t know what ADG would had been (The Free Air Gradient values), - if the building not was where it is. This is a very bad excuse.

3lines.jpg


According to the prevailing speculation, - the free air gradient and a "zeroline"
MUST merge perfectly at the buildings physical mass center.
​


The meaning of the 3 lines below:

Blue line
The Free Air Gradient.
This must be possible easy to determinate at a central place of the building, and can only cause a deviation of maximum 10 microgal.
Simply because at the building physical center, the building should not effect ADG. - So here Hans can easy find (the start) of his "zero line"
Off course the blue line must be mathematical reliable (according to the prevailing thesis)


Green Line
This represent ADG measured values. ( the report)
This line is too is very reliable.
Measurement accuracy = 6 to 8 microgal
Bumps up and down can be neutralized by finding the average value.


So we have already two very reliable "data lines"


Red line
Calculated prediction / values according to the prevailing thesis.
  • +100 microgal in the top of the building
  • -100 microgal in the bottom of the building

We can easy calculate that there are no consistencies between: - on the one hand the red line, - and - on the other hand the green / blue line.
This mean reality (the blue and green line) reject the prevailing mathematical understanding ( the red line) , and hence the hole thesis, - because that thesis is only mathematical based speculation, nothing else. ..
The thesis is simply wrong.
-
 
Last edited:
The point and "problem" is so far I understand that RC and Hans (ect....) don’t know what the buildings ADG would had been if the building not was where it is. This is a very bad excuse.

How is it bad? If you don't know the gradient without the building there, how do you know what the contribution of the building is in your measurements?
 
Status
Not open for further replies.

ISF - Join now!

Every member here is approved by hand. No bots, no spam, just people who care about evidence and honest debate.

Membership is free!

Create your free account

Back
Top Bottom