The software computes the average and draws the line.
It's a best fit, not the average as such. It's still a straight line placed over a wiggly one.
You do not create new accuracy that was not there in the first place by placing a straight line over the top of a wiggly one.
You can eliminate some noise using a variety of techniques, but you cannot remove it all.
All a best-fit linear regression gives you is an estimated average between two points in time.
All manner of real variation can occur during that time.
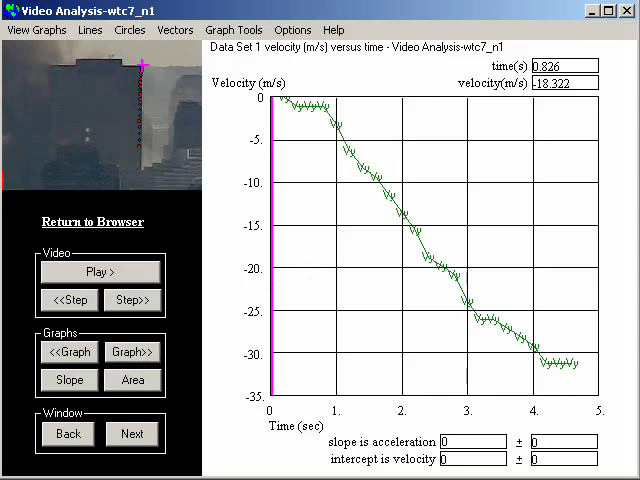
It is designed to compute the velocity of objects in a video and that's the way it's done.
lol. It uses a simple symmetric difference calculation to derive to velocity.
Derivation can be performed in a number of ways.
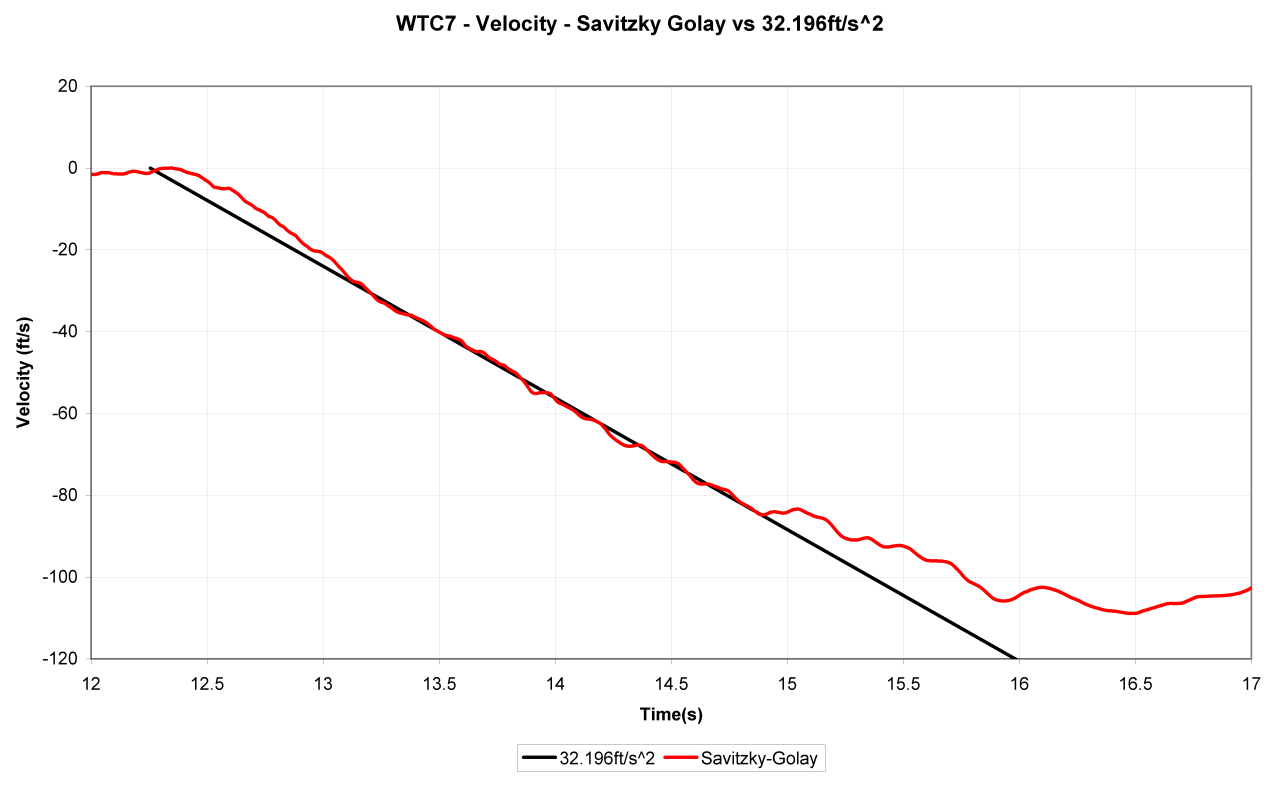
The Savitzky-Golay smoothing method I use performs a mathematical differentiation of each curve fit function (which is very handy). There is one curve fit per sample. Hundreds of 'em.
In the debate, Dave acknowledged "there was a 2 er 1 3/4 second period of FFA of this outer shell". He's probably referring to your graph and he understands that it confirms at least 1.75s of FFA.
Why don't you ask him, rather than guess ?
I have no great issue with folk suggesting ~1.75s of ~FFA during which the NW corner descended ~83ft.
Not one "~" is optional.
Your data points are closer to the free fall line than Chandlers or NIST's.
Correct in places. In others further away.
You're welcome. I do suggest you start listening to the interpretations that do not fit your chosen and preferred outcome.
Since data taken from a video is imprecise
Correct, though for many different reasons. ALL measurement is imprecise. Many other noise sources exist.
a straight line thru the average of the data points is the logical scientific conclusion.
Incorrect. That's simply an average, not a conclusion. An approximation.
That is the accepted way it is done.
An accepted way, sure. However, that's by folk who have no problem stating APPROXIMATELY, AVERAGE, ...
You do have a problem with that, but it's YOUR problem.
Add the approximation qualifiers and you'll be fine.
Your interpretation that WTC 7 was varying around FFA is wrong.
ROFL. Nonsense.
You actually think that a non-spherical object outside of a vacuum will "fall" AT FFA on the surface of this planet ?
Did you know an apple dropped from the roof would take >8s to hit the ground (In a vacuum it would be <6s)
")
You have NO WAY to determine acceleration with any more accuracy than I do. You can estimate. About FFA for a bit. Around FFA for a bit. Roughly FFA for a bit. Some >g