Richard Gage Blueprint for Truth Rebuttals on YouTube by Chris Mohr

Status
Not open for further replies.
Originally Posted by BasqueArch
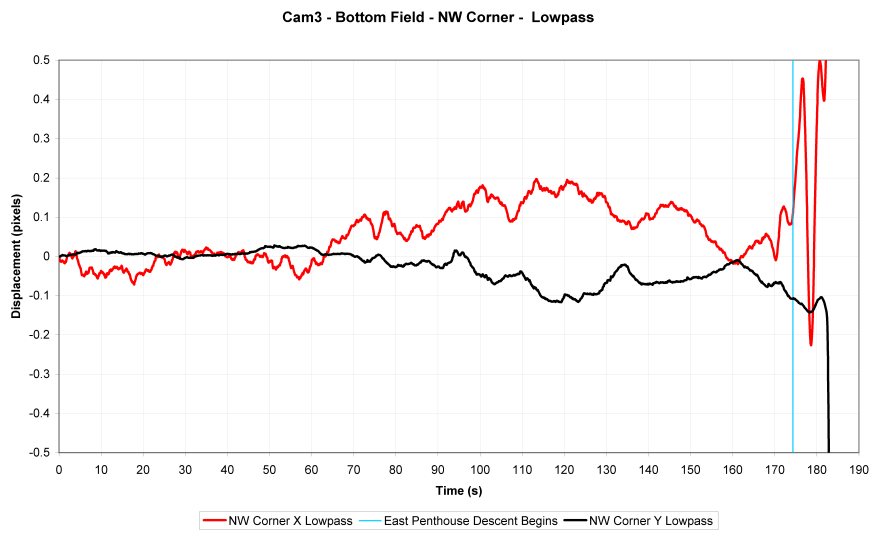
There's no engineering reason why the NW corner should be hopping up and down past 0 acceleration from 1(s)-6(s).
Deriving to acceleration amplifies small noise in the displacement data significantly.

That’s the point. The acceleration data is a function of the wrong displacement,time data which needs to be calibrated to produce a flat 0 acceleration. It's not the acceleration data itself that needs to be adjusted.

BA-
The period 1(s)-6(s) should be recalibrated to produce a flat line 0 acceleration.
femr2-It doesn't work like that I'm afraid. I can perhaps filter out some more noise, but it cannot be eliminated completely, and will remove real data in the process.
That’s the point. The real data is not what you have because it produces the wrong acceleration data. What you have is inadequately adjusted sampling error.


BA- This adjustment should be applied to the subsequent data (displacement,time) to see what the more accurate adjusted acceleration line would look like.
femr2 . Savitzky-Golay smoothing is applied at each derivation step already.
The S-G smoothing is being applied to the acceleration line derived from the wrong displacement, time data.


BA-A vertical line indicating the start of the east PH fall and the start of the NW corner fall would help.
femr2-
It's present on other graph, but this one is too long a timescale for it to be useful imo.
It’s useful to know, graphically, at what acceleration point the penthouse and NW wall fell. If you don't want to do it no one can force you.
 
Last edited:
My T0 is ~11.9s.
The vertical lines are very faint. my bad. On closer inspection, I would put it at 12 s. ?

femr4ee.jpg


The NW corner has reached~10ft/s2 by 12.3s
OK

They are different points on the building, and will have slightly different effective release points.

I'll dig out a frame accurate timing sync if I can be bothered.
That would be good.

Your acceleration graph does not agree with your velocity curve on the NIST graph.

On your acceleration graph, >g lasts for 1.0 s.
On the NIST graph, your velocity [speed] is accelerating at >g for 0.5 s.

On your acceleration graph, there is 0.5 s period of g.
On the NIST graph, your velocity is accelerating at g for 1.5 s.
 
On closer inspection, I would put it at 12 s. ?
On closer inspection (on a graph you've seen several times)...
http://femr2.ucoz.com/_ph/7/5930538.png
...a bit earlier. You then have to cross-reference between acceleration, velocity and displacement to get a reasonable T0.

Your acceleration graph does not agree with your velocity curve on the NIST graph.
Incorrect. It is the same data integrated.

You cannot get very clear information of the sort you mention about acceleration from a velocity graph. The acceleration graph linked above includes the NIST linear fit, accurately placed. Use that instead when you talk about acceleration.
 
That’s the point. The acceleration data is a function of the wrong displacement,time data which needs to be calibrated to produce a flat 0 acceleration. It's not the acceleration data itself that needs to be adjusted.
You're not listening. It doesn't work that way. It is not possible to remove all noise from the signal. SG smoothing is already applied at all steps from displacement to acceleration.

There is a margin of error.

You can't just "calibrate to 0", as the noise is effectively random.

Noise levels can perhaps be reduced by additional smoothing, but that also smooths out real variation in the data.

There has to be a compromise between raw data (with noise) and noise reduction via smoothing methods.

The real data is not what you have because it produces the wrong acceleration data.
There is a margin of error. The more smoothing that is applied the real data is also smoothed out.

What you have is inadequately adjusted sampling error.
Incorrect. Savitzky-Golay smoothing is certainly adequate for the purpose in hand.

There is, and always will be, a margin of error. You can easily/simply say there's a +/-3ft/s2 variance on the acceleration data.

The S-G smoothing is being applied to the acceleration line derived from the wrong displacement, time data.
You're still not listening.

It’s useful to know, graphically, at what acceleration point the penthouse and NW wall fell. If you don't want to do it no one can force you.
Done many times on other graphs...

...but can stick it on the graph when I get time. In the meantime, feel free to draw a line on your copy at the 6s mark, and 11.9s mark. Seemples.
 
... but we are concerned with what happened during Stage 2. ...

Read: We will ignore Stage 1 so we can invent FALSE explanations about how Stage 2 came about ("simultaneous removal of all vertical supports" yadda yadda).
 
You're not listening. It doesn't work that way. It is not possible to remove all noise from the signal. SG smoothing is already applied at all steps from displacement to acceleration.

There is a margin of error.

You can't just "calibrate to 0", as the noise is effectively random.

Noise levels can perhaps be reduced by additional smoothing, but that also smooths out real variation in the data.

There has to be a compromise between raw data (with noise) and noise reduction via smoothing methods.


There is a margin of error. The more smoothing that is applied the real data is also smoothed out.


Incorrect. Savitzky-Golay smoothing is certainly adequate for the purpose in hand.

There is, and always will be, a margin of error. You can easily/simply say there's a +/-3ft/s2 variance on the acceleration data.


You're still not listening.


Done many times on other graphs...

...but can stick it on the graph when I get time. In the meantime, feel free to draw a line on your copy at the 6s mark, and 11.9s mark. Seemples.
If you say that's the best you can do, I believe you.
 
The reasons for the hopping up and down don't matter. Period 1(s)-6(s) should be adjusted to produce a flat line 0 acceleration. A narrower margin of error should result for the subsequent acceleration line.

There is probably no way to distinguish true random noise from actual building vibration (if there actually was any - which is a priori not totally impossible: The collapse sequencem according to NIST, began with massive floor failures before the visible drop of the EMP. I don't know if elastic waves could develop from that strong enough to make the roofline bob up and down. Perhaps someone has given this thoughts before?).

Also, there is probably no way to use what we know about pre-release random noise to smooth post-release data, unless there is reliable frequency.

It might be possible to subtract non-random noise that's caused by camera movement by looking at nearby reference points, but such reference points would come with some random noise of its own, too, and if there is no real camera movement, adjusting post-release data by subtracting delta-h's of some reference point might even add noise to the data.


The best approach would be to derive some statistical measure of error of margin, and aplly it to the plot. I guess we can approximate this by eyeballing the pre-release curve: Most of the noise is confined to +/- 3 ft/s2 (this supposes that the margin of error / amplitude of noise of the displacement data translates validly into variation of acceleration via femr2's method; a supposition that I am not qualified to judge), so it would seem that the curve really does drop below the g-line significantly, as the minimum value on the graph is ca. -g -7 ft/s2
 
Last edited:
If you say that's the best you can do, I believe you.
The raw data is there for all and sundry if you want to try other methods.

I'll get round to releasing the Cam#3 data at some point, as it's significantly cleaner...

...(+/- 0.01px variance on static region) but due to the viewpoint perspective I would not recommend using it for deriving acceleration data.
 
There is probably no way to distinguish true random noise from actual building vibration...Perhaps someone has given this thoughts before?.
Pre-release variance on the Dan Rather trace data is most likely noise than actual motion.

Also, there is probably no way to use what we know about pre-release random noise to smooth post-release data, unless there is reliable frequency.
Low-pass filtering proved useful on the Cam#3 data, but was not applied to the Dan Rather data.

It might be possible to subtract non-random noise that's caused by camera movement by looking at nearby reference points
Already done on the data you've been looking at. It results in clear improvement in quality. NIST didn't bother btw.

but such reference points would come with some random noise of its own, too
Correct, but I am able to use a much larger trace region for static point data collection, reducing other noise sources significantly.

and if there is no real camera movement
There is.

adjusting post-release data by subtracting delta-h's of some reference point might even add noise to the data.
Variance on static traces is significantly lower than NW corner traces, due to trace region size. The result is that, yes, some noise is added, but it is significantly lower than the NW corner noise itself and the camera motion is of a much larger magnitude than static region variance.
 
Last edited:
C7 said:
Your acceleration graph does not agree with your velocity curve on the NIST graph.
Incorrect. It is the same data integrated.
:confused: The results must agree or you have done something wrong.

You cannot get very clear information of the sort you mention about acceleration from a velocity graph.
Yes you can. The programs NIST and Chandler used were designed to calculate acceleration.

Acceleration is an increase in the velocity [speed]. If the increase in speed is on or parallel to the g slope then the object if falling at g. If it is steeper, that it is falling at >g.

The acceleration graph linked above includes the NIST linear fit, accurately placed. Use that instead when you talk about acceleration.
They don't match. The acceleration graph has no period on g and the velocity graph does.
 
There is probably no way to distinguish true random noise from actual building vibration (if there actually was any - which is a priori not totally impossible: The collapse sequencem according to NIST, began with massive floor failures before the visible drop of the EMP. I don't know if elastic waves could develop from that strong enough to make the roofline bob up and down. Perhaps someone has given this thoughts before?).

The floor collapses occurred in the eastern portion at different times in bay sized portions, not the entire floor, and these measurements are from the NW corner on the opposite end of the building reducing the likelihood of this, but I can’t quantify it. From the acceleration curve and time I very roughly estimate at 6”-8” of net max-min bobbing. This figure can certainly be revised by better math. I doubt the staged floor collapses at the eastern end could have caused this magnitude of bobbing at the western corner, but I have no math for this.

Also, there is probably no way to use what we know about pre-release random noise to smooth post-release data, unless there is reliable frequency.
It might be possible to subtract non-random noise that's caused by camera movement by looking at nearby reference points, but such reference points would come with some random noise of its own, too, and if there is no real camera movement, adjusting post-release data by subtracting delta-h's of some reference point might even add noise to the data.
The best approach would be to derive some statistical measure of error of margin, and aplly it to the plot. I guess we can approximate this by eyeballing the pre-release curve: Most of the noise is confined to +/- 3 ft/s2 (this supposes that the margin of error / amplitude of noise of the displacement data translates validly into variation of acceleration via femr2's method; a supposition that I am not qualified to judge), so it would seem that the curve really does drop below the g-line significantly, as the minimum value on the graph is ca. -g -7 ft/s2

If the NW corner should not have moved for the last 5 seconds before the EPhouse collapse, then one could adjust this displacement,time data to produce a close to 0 acceleration for this 5 second period. This function could be applied to the remainder of the data. This is outside my field, it's a reasonable question. I know of no engineering reason the NW corner should be bobbing net 6-8”.

Perhaps no further accuracy is possible. Assuming the NW corner should not be moving before the EPH collapse, WDClinger could opine as to wether an improvement in the acceleration curve is possible.
The bobbing differences appear relaitvely small. Since some of these factors use exponentials, however , the differences might be significant.
 
Last edited:
:confused: The results must agree or you have done something wrong.
They do agree. You are reading the graphs with mittens on.

Slight variation in velocity results in amplified variation in acceleration when derived.

Yes you can.
You really can't with the resources you have available.

The programs NIST and Chandler used were designed to calculate acceleration.
Here we go again :rolleyes:

What programs did NIST and Chandler use ?

You are again showing your lack of understanding.

NIST and Chandler performed a very simple linear fit to velocity data, which results in an average acceleration over their chosen period. It's trivially simple maths.

I suggest you answer my questions from earlier. Finding out the answers will help you understand why these discussions don't go as you'd like.

Acceleration is an increase in the velocity [speed]
Acceleration is the rate of change of velocity with time.

If the increase in speed is on or parallel to the g slope then the object if falling at g. If it is steeper, that it is falling at >g.
A very primitive method, but it kinda works...if you have a large enough graph so you can see the fine detail.

You don't have that detail in the graph, so you can't make accurate judgements from it.

They don't match.
ROFL.The match. I think the main problem is that you don't know what you're looking at.

The acceleration graph has no period on g and the velocity graph does.
No, it does not. You can't see fine detail on the velocity graph. Simple as. If you continue to hand-wave I guess I'll have to waste time proving it to you.
 
The floor collapses occurred in the eastern portion at different times in bay sized portions, not the entire floor
You have no accurate way of knowing what occurred internally.

From the acceleration curve and time I very roughly estimate at 6”-8” of net max-min bobbing. This figure can certainly be revised by better math.
By all means apply "better math" to the data. I'd be more than curious to see the results.

If the NW corner should not have moved for the last 5 seconds before the EPhouse collapse
Why do folk here have such short attention span/memory ?

The NW corner was in motion long before release...


You quoted that image less than four HOURS ago.

I know of no engineering reason the NW corner should be bobbing net 6-8”
Again, it's amplified noise. It can maybe be reduced slightly but it's not going away with data taken from the Dan Rather footage. As you can see above, noise levels in the Cam#3 data are much reduced.

Perhaps no further accuracy is possible.
I know of no way to extract higher fidelity data. The techniques were refined over a period of about 18 months. Anyone wanting to give it a whirl is more than welcome.

Assuming the NW corner should not be moving before the EPH collapse
It is moving.

Use Cam#3 graphs if you're interested in displacement. Use Dan Rather graphs if you're interested in acceleration. Dan Rather data is noisier than Cam#3 data. Nothing to do with the data extraction method or data treatment, simply video quality. And, yes, I have the highest quality Dan Rather footage I can lay my hands on.
 
The floor collapses occurred in the eastern portion at different times in bay sized portions, not the entire floor, and these measurements are from the NW corner on the opposite end of the building reducing the likelihood of this, but I can’t quantify it. From the acceleration curve and time I very roughly estimate at 6”-8” of net max-min bobbing. This figure can certainly be revised by better math. I doubt the staged floor collapses at the eastern end could have caused this magnitude of bobbing at the western corner, but I have no math for this.
Right. I have no math as well, and would share your guess that the floor collapses wouldn't produce measurable (by a distant TV camera) displacement at the NW roof, just saying we can't rule this out a priori - without math or a similarly competent method

If the NW corner should not have moved for the last 5 seconds before the EPhouse collapse, then one could adjust this displacement,time data to produce a close to 0 acceleration for this 5 second period.
Using what? Fourier analysis? You can mimick any function as closely as you like with those, but would not learn anything of substance about the nature of the random fluctuation. You'd simply pull the line flat, by forcing it to be so. You can get that result more simply: Just draw a straight line with ruler and pencil.

This function could be applied to the remainder of the data.
No. Fourier transformation of a random signal has no predictive power.

This is outside my field, it's a reasonable question. I know of no engineering reason the NW corner should be bobbing net 6-8”.

Perhaps no further accuracy is possible. Assuming the NW corner should not be moving before the EPH collapse, WDClinger could opine as to wether an improvement in the acceleration curve is possible.
The bobbing differences appear relaitvely small. Since some of these factors use exponentials, however , the differences might be significant.
Random error means, almost by definition, that you can't eliminate it.
 
Pre-release variance on the Dan Rather trace data is most likely noise than actual motion.
---
Low-pass filtering proved useful on the Cam#3 data, but was not applied to the Dan Rather data.
---
Already done on the data you've been looking at. It results in clear improvement in quality. NIST didn't bother btw.
---
Correct, but I am able to use a much larger trace region for static point data collection, reducing other noise sources significantly.
---
There is.
---
Variance on static traces is significantly lower than NW corner traces, due to trace region size. The result is that, yes, some noise is added, but it is significantly lower than the NW corner noise itself and the camera motion is of a much larger magnitude than static region variance.

Thanks! You explain what is obviously quality work well, here on a level of depth that I can work with / understand.
 
*confused*
Perhaps clearer to say that magnitude of noise in the Dan Rather trace masks any slight early motion within it. You can't see any actual motion for the noise it's mixed with.

Early motion is slight. Inches.

All NW corner, yes.
 
Last edited:
Perhaps clearer to say that magnitude of noise in the Dan Rather trace masks any slight early motion within it. You can't see any actual motion for the noise it's mixed with.

Early motion is slight. Inches.

All NW corner, yes.

Ah but other cameras show variation > margin of error for NW corner pre-release?
 
Ah but other cameras show variation > margin of error for NW corner pre-release?
Yes. Cam#3. Not very suitable for performing derivation of velocity and acceleration from that viewpoint, but significantly higher accuracy and lower noise for raw displacement data extraction.
 
Status
Not open for further replies.

Back
Top Bottom