Yes. When you say "Downward force starts reducing from that point but so does upward force. Over-g reached."
That's where you are wrong. The exterior columns are providing resistance. i.e. no FFA.
That's basically the same as saying, "A tennis ball floats, preventing it from sinking. Even if there is a hand pushing it down". And just as silly and misguided.
That's basically the same as saying, "A tennis ball floats, preventing it from sinking. Even if there is a hand pushing it down". And just as silly and misguided.
The fact that it's a fluid has nothing to do with it, only with the origin of the force, but in the end, it's a question of forces.
Buoyancy is a force pointing upwards, so is resistance. The core exerts a downwards force, so does the hand. When the hand's force equals the buoyancy force, the ball will sink as if its buoyancy were zero. When the pull-down force equals the resistance, the building will experience free fall as if its resistance were zero. Very elemental physics you still fail to understand.
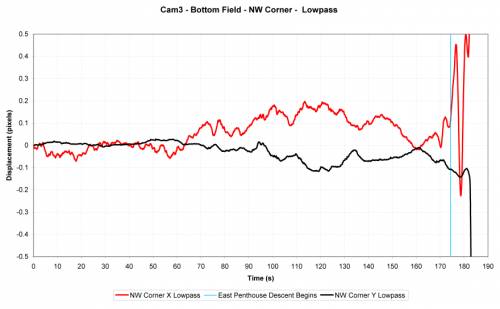
Ok. Were all these data taken at the same point, NW corner? This looks like it began near the start of the east penthouse fall. Do you have anything 10-15 seconds prior.
Not from the Dan Rather viewpoint. NIST Cam#3, yes, which I have better resolution data from, but it has all of the perspective issues that the viewpoint incurs.
That's basically the same as saying, "A tennis ball floats, preventing it from sinking. Even if there is a hand pushing it down". And just as silly and misguided.
Another excellent analogy about force. But you have the same pearls / swine problem as always. Truthy people don't do analogies; it mucks up their intentional ignorance mojo.
Correct, but we are concerned with what happened during Stage 2.
On your acceleration graph, the descent begins at 12.3 s.
That equates to 1.25 s on the NIST graph.
The velocity increases from 0 to g in
0.5 s. >g begins and lasts for
1.0 s. then it transitions to <g.
On the NIST graph, your velocity curve begins at 0, descending at ~1'/s [should be 0 to match your acceleration graph].
This lasts until ~1.25 s.
The velocity increases from 1'/s to g in
0.5 s. >g begins and lasts for
0.5 s. then it transitions to g for
1.5 s. then it transitions to <g
Acceleration line at NW corner. Column 79 and east penthouse collapse at 6(s). There's no engineering reason why the NW corner should be hopping up and down past 0 acceleration from 1(s)-6(s). It should be a flat line 0. Gravity was pulling down, there was no column expansion due to the heating of the corner columns as these column temperatures were too low and the weight above too great.
The period 1(s)-6(s) should be recalibrated to produce a flat line 0 acceleration. This adjustment should be applied to the subsequent data (displacement,time) to see what the more accurate adjusted acceleration line would look like. A vertical line indicating the start of the east PH fall and the start of the NW corner fall would help.
Acceleration line at NW corner. Column 79 and east penthouse collapses at 6(s). There's no engineering reason why the NW corner should be hopping up and down past 0 acceleration from 1(s)-6(s). It should be a flat line 0. Gravity was pulling down, there was no column expansion due to the heating of the corner columns as these column temperatures were too low and the weight above too great.
The period 1(s)-6(s) should be recalibrated to produce a flat line 0 acceleration. This adjustment should be applied to the subsequent data (displacement,time) to see what the more accurate adjusted acceleration line would look like. A vertical line indicating the start of the east PH fall and the start of the NW corner fall would help.
That "hoping up and down" is the vibrations in the floor where the camera tripod is standing. WTC 7 was several moles away and the slightest movement in the camera will create the "noise" you see on the graph as hoping up and down. There is also atmospheric disturbance.
That "hoping up and down" is the vibrations in the floor where the camera tripod is standing. WTC 7 was several moles away and the slightest movement in the camera will create the "noise" you see on the graph as hoping up and down. There is also atmospheric disturbance.
The reasons for the hopping up and down don't matter. Period 1(s)-6(s) should be adjusted to produce a flat line 0 acceleration. A narrower margin of error should result for the subsequent acceleration line.
It doesn't work like that I'm afraid. I can perhaps filter out some more noise, but it cannot be eliminated completely, and will remove real data in the process.
This adjustment should be applied to the subsequent data (displacement,time) to see what the more accurate adjusted acceleration line would look like.
Here goes another. Imagine a special form of arm-wrestling, where instead of pushing laterally, one of the opponents pushes up and the other pushes down. The one pushing down has the advantage of gravity: his arm and his opponent's arm have a weight, meaning more force pushing down.
Same case as WTC7 and the tennis ball: two opposite forces into play, plus gravity.
What you're saying is akin to saying that the one pushing down can never win under any circumstances, because there will always be resistance exerted by the one pushing up. In reality, though, when the forces the two people are exerting are equal, the one pushing down will win thanks to the help of gravity.
I know, I know. Steel is not flesh and bones, right? Certainly, but we're still discussing forces. Forces are independent of media and materials.
Another example: remember the crane video? There was a falling piece and a crane arm. The crane arm had resistance. The falling piece exerted a force downwards. The dynamic effect, transmitted to the arm through the somewhat elastic cable, caused for an instant a force much greater than the resistance of the arm, making it fail and accelerate very quickly from zero to a significant velocity.
But your statement that FFA means zero resistance of the columns regardless of the downards force, is akin to saying that the arm falling at all means zeronegative resistance of the arm, regardless of the yank exerted by the falling piece. That's nonsense.
The reasons for the hopping up and down don't matter. Period 1(s)-6(s) should be adjusted to produce a flat line 0 acceleration. A narrower margin of error should result for the subsequent acceleration line.
Largely incorrect. Camera motion (static region data) is extracted from the position/time data already.
It is "noise", which occurs from many unavoidable sources, including remnant camera motion.
The Dan Rather footage is not the best. The cam#3 footage is better quality, but suffers from perspective issues for the purpose of deriving acceleration.
This site uses cookies to help personalise content, tailor your experience and to keep you logged in if you register.
By continuing to use this site, you are consenting to our use of cookies.


") I know. I'm telling you.
I know. I'm telling you.