Richard Gage Blueprint for Truth Rebuttals on YouTube by Chris Mohr

Status
Not open for further replies.
Hogwash. Both NIST and Chandler said WTC 7 fell at FFA based on their analysis.

For the umpteen billionth time, NIST and Chandler were playing with average acceleration rates. We all already know that you have great difficulties understanding the difference between instantaneous and average acceleration, so for all our sakes, stop blindly repeating this line as if it is gospel. It isn't.
 
Now, the core collapses and starts to fall. The beams and girders transmit force from the falling core to the perimeter. The perimeter was until that point just holding its own weight and that of the connected floors as normal.

http://www.formauri.es/personal/pgimeno/xfiles/11-s/wtc7fall2.png

The core is now effectively pulling the perimeter downwards. Elastic tension accumulates. The perimeter can't bear its own weight plus that of the core and fails. There may be a certain dynamic overloading effect at this point, but it's probably mostly static overloading.
Your analysis is correct until "Over g reached". The exterior columns are buckling and providing substantial resistance = no FFA, much less over g.

Under that elasticity hypothesis, the core could have bounced
:D :D :D :D :D That is abject silliness.

if the perimeter and girders resisted, and go upwards. It's not a physical impossibility.
Yes it is. :rolleyes:

Sometimes this BS is very entertaining.
 
You are nobody and your graphs are a bunch of pseudo science. You used a program that was not designed to measure velocity. NIST and Chandler knew what programs to use. You do not know better than NIST and Chandler.
I'll ask again, since you apparently missed the question.

What programs did NIST and Chandler use to extract the data?

By the way, femr2's software is designed to track motion. With pretty straightforward calculations, it's easy to translate the motion (given in pixels by the program) to velocity in real world units. Probably even you could make these calculations.

Hogwash. Both NIST and Chandler said WTC 7 fell at FFA based on their analysis.
Bull ****. NIST gave fits to two functions. You're focusing only on the linear regression fit. The other curve fit goes over g. Neither of them is very accurate. Neither of them pretends to represent the instantaneous velocity.
 
For the umpteen billionth time, NIST and Chandler were playing with average acceleration rates.
No they were not! The "average" refers to the dots, not the acceleration. The dots, taken from a video, are not exact so an average of the dots is taken. The result is FFA.
 
Last edited:
Your analysis is correct until "Over g reached". The exterior columns are buckling and providing substantial resistance = no FFA, much less over g.
Even if that was the case, the sum of downward forces exceeded your "substantial resistance". That's what caused over-g acceleration.

ETA: You're not suggesting that the resistance of the buckling perimeter columns was enough to counter the weight of the perimeter plus the weight of the falling core, right?
 
Last edited:
No they were not! The "average" refers to the dots, not the acceleration. The dots, taken from a video, are not exact so an average of the dots is taken. The result is FFA.
Anyone wants to stundie this? I'm far too flabbergasted.
 
C7 said:
Your analysis is correct until "Over g reached". The exterior columns are buckling and providing substantial resistance = no FFA, much less over g.
Could you show your math for this? Can you show anything to support this?
It doesn't require math unless you want to know exactly how much resistance.

Bending columns provide resistance
and prevent FFA, as I pointed out in post 5237:

http://www.internationalskeptics.com/forums/showpost.php?p=8339935&postcount=5237

This is a fact that y'all are trying to deny with endless double talk. I know y'all are not as stupid as you are pretending to be.
 
Anyone wants to stundie this? I'm far too flabbergasted.
Horse feathers. NIST and Chandler [and any reasonable person] can easily understand this.

NCSTAR 1-A pg 45 [pdf pg 87]
"The slope of the velocity curve is approximately constant between about 1.75 s and 4.0 s, and a good straight line fit to the points in this range (open-circles in Figure 3-15) allowed estimation of a constant downward acceleration during this time interval. This acceleration was 32.2 ft/s2(9.81 m/s2), equivalent to the acceleration of gravity g." [within 0.1%]

You are either in denial or lying.
 
NCSTAR 1-A pg 45 [pdf pg 87]

"The slope of the velocity curve is approximately constant between about 1.75 s and 4.0 s, and a good straight line fit to the points in this range (open-circles in Figure 3-15) allowed estimation of a constant downward acceleration during this time interval. This acceleration was 32.2 ft/s2(9.81 m/s2), equivalent to the acceleration of gravity g." [within 0.1%]

Bolding mine :rolleyes:

In bits (in more ways than one)...

The slope of the velocity curve is approximately constant

Approximately. Not constant. Therefore acceleration is not constant.


good straight line fit

Good, not perfect. A linear fit. Approximate. A linear average over the period.


estimation of a constant downward acceleration during this time interval

Estimation. Straight line fit, so cannot be anything other than constant.


equivalent to the acceleration of gravity


Not at.


All based on fairly low-grade data.


If you want to say that the NW corner reached approximately "FFA" about a second after it started moving, and continued at approximately "FFA" for another second or so (which is damn rapid).....fine !

Repeating the same nonsense over and over just causes you problems.
 
Last edited:
NCSTAR 1-A pg 45 [pdf pg 87]
"The slope of the velocity curve is approximately constant between about 1.75 s and 4.0 s,
Highlighted a keyword you're ignoring all this time.

If NIST thought it was instant acceleration "within 0.1%" during the whole period they highlight, they would not have used that word.

ETA: Beaten to it by femr2 :D
 
Christopher7: "Hogwash. Both NIST and Chandler said WTC 7 fell at FFA based on their analysis."


to which Pgimeno responds: "Bull ****. NIST gave fits to two functions. You're focusing only on the linear regression fit. The other curve fit goes over g. Neither of them is very accurate. Neither of them pretends to represent the instantaneous velocity."


Pgimeno, what explanation did the NIST give for the period of g to over g acceleration?


Is there any known example of a building doing this except for the 1515 Flagler Dr demolition?


The Demolition of 1515 Flagler Dr...

44753876.png

898155405.png


A quick look at derived acceleration suggests very near to freefall, if indeed it is not actually reached...

657018636.png
 
Last edited:
"In motion" = word games.
Nope. Static = static. In motion = in motion.

You know what I meant.
Yes, but you were incorrect.

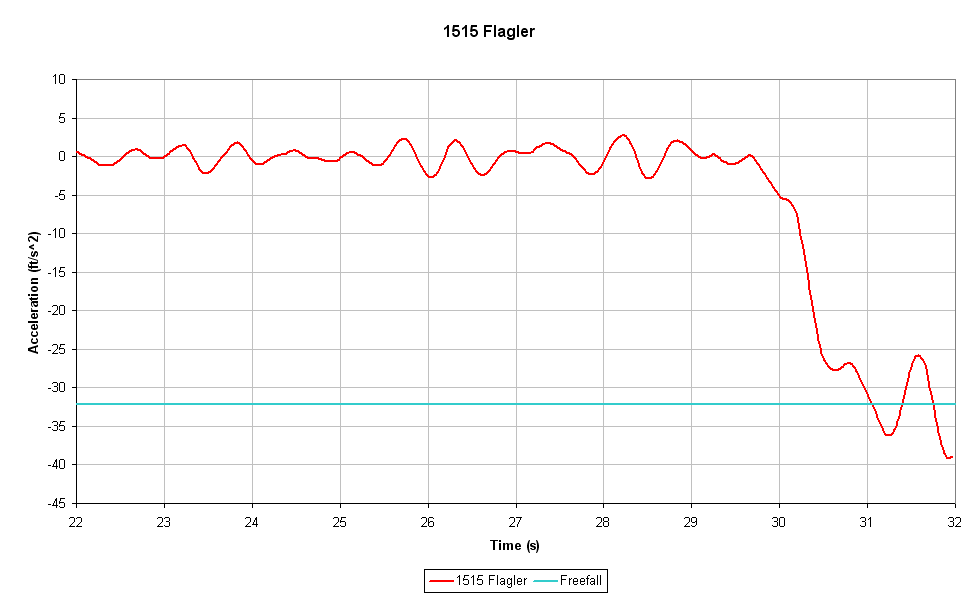
The NW corner was not descending at all and then it went into FFA.
Depends what angle you look from (and how much actual motion you deem "unimportant"). Flexure of the North facade was quite complex, and to make correct statements you must look at multiple angles.

And most importantly...it did not go from static straight to "FFA" in the slightest. It took time to accelerate. About a second.

The screen shots in post 5185 are enough to determine that there was no significant downward movement of the NW corner and a slight downward movement of the rest of the roofline before the onset of FFA.
Yet if you look at the same building from another viewpoint, the perceived motion differs.

You need to look closely from multiple angles.

You are nobody and your graphs are a bunch of pseudo science.
I'm crushed :)

You used a program that was not designed to measure velocity.
Correct. I used a program designed to track extremely fine motion (although it does indeed show velocity in pixel units, which could be calibrated via setup of a coordinate system...in 3D :) That inclusion is, however, intended to help de-glitch traces rather than anything else, and it won't "smooth" ). Translation to real-world units, and derivation of velocity and acceleration was performed separately, as I've already said earlier.

NIST and Chandler knew what programs to use.
What programs did they use ?

You do not know better than NIST and Chandler.
Better ? I spent time extracting higher fidelity data s'all.

The results differ, as the data is are more accurate, enabling me to make more specific statements about the motion. That's all.
 
Last edited:
A quick look at derived acceleration suggests very near to freefall, if indeed it is not actually reached...
With a mechanism equivalent to this:


which is very different to the one in action in WTC7 which is more similar to this:

 
NIST and Chandler knew what programs to use.
What programs did they use to:

a) Process the raw video data ? (deinterlace)

b) Extract the motion data ?

c) Translate the pixel unit motion data into real world units (px->ft) ?

d) Derive velocity and acceleration ?
 
With a mechanism equivalent to this:


which is very different to the one in action in WTC7 which is more similar to this:


What was the explanation given by the NIST? Did they offer a mechanism for the freefall period or did they leave it to each person to figure it out for themselves?
 
Last edited:
What was the explanation given by the NIST? Did they offer a mechanism for the freefall period or did they leave it to each person to figure it out for themselves?
You owe me a lot of answers before I respond to any of your questions.
 
Last edited:
The slope of the velocity curve is approximately constant
By "velocity curve" do you mean that meaningless curved line that does not follow the dots?

Approximately. Not constant. Therefore acceleration is not constant.
They are talking about the curved line.

good straight line fit
Good, not perfect. A linear fit. Approximate. A linear average over the period.
The data points are not perfect because they are taken from a video but the average gives the actual acceleration - FFA.


estimation of a constant downward acceleration during this time interval
To within one tenth of a percent. NIST said it was free fall. You just refuse to accept that.

Estimation. Straight line fit, so cannot be anything other than constant.
That's correct. The core was just ahead of the exterior but the entire upper portion falls as a single unit. Even NIST admits this but y'all deny it.

equivalent to the acceleration of gravity
Not at.
Denial.
 
Status
Not open for further replies.

Back
Top Bottom