From Bazant and Verdure, the capacity of a column to resist being contracted:

Elastic contraction in yellow. After a short contraction, the ability to resist drops dramatically. This sharp drop in an upward resistance force allows the beginning of downward acceleration at a significant fraction of g.
This will be seen as a sharp transition in the velocity. The slope of the velocity curve is the acceleration, so we would expect a clear change in slope from near zero to anywhere between 0.5g to 1.0g.

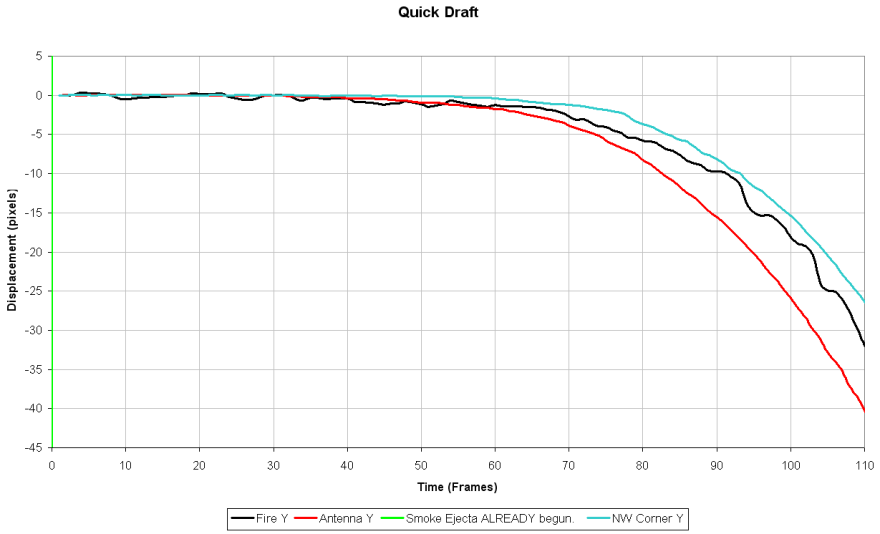
The blue curve is the position of the NW corner in each frame. The purple curve is the slope of the blue curve, the downward velocity. The transition of the slope of the velocity curve is obvious. Acceleration obviously changes from zero to o.5g to 1.0 g around frame 224.
Geometrically, this transition point must happen just as the NW corner starts to deform into a buckle. This means that it happens at the first moments of downward displacement at the velocity transition point, around frame 224.
So guys, any way you look at it, as a sharp drop in resistive force just after the yellow-pink transition point in the Bazant load-displacement diagram or as the velocity and acceleration take-off point in the drop curve, your moment of failure of the NW corner happens at the same time.
I don't see any way to argue that the downward velocity transition point is not the point of failure. Sharp drop in upward force means accleration takes off. The shape of the graphs show this is the only natural transition and it is so noticable, it will hit you in the nose if you are not careful.
Elastic contraction in yellow. After a short contraction, the ability to resist drops dramatically. This sharp drop in an upward resistance force allows the beginning of downward acceleration at a significant fraction of g.
This will be seen as a sharp transition in the velocity. The slope of the velocity curve is the acceleration, so we would expect a clear change in slope from near zero to anywhere between 0.5g to 1.0g.
The blue curve is the position of the NW corner in each frame. The purple curve is the slope of the blue curve, the downward velocity. The transition of the slope of the velocity curve is obvious. Acceleration obviously changes from zero to o.5g to 1.0 g around frame 224.
Geometrically, this transition point must happen just as the NW corner starts to deform into a buckle. This means that it happens at the first moments of downward displacement at the velocity transition point, around frame 224.
So guys, any way you look at it, as a sharp drop in resistive force just after the yellow-pink transition point in the Bazant load-displacement diagram or as the velocity and acceleration take-off point in the drop curve, your moment of failure of the NW corner happens at the same time.
I don't see any way to argue that the downward velocity transition point is not the point of failure. Sharp drop in upward force means accleration takes off. The shape of the graphs show this is the only natural transition and it is so noticable, it will hit you in the nose if you are not careful.