You are using an out of date browser. It may not display this or other websites correctly.
You should upgrade or use an alternative browser.
You should upgrade or use an alternative browser.
Merged Discussion of femr's video data analysis
- Thread starter tfk
- Start date
DGM
Skeptic not Atheist
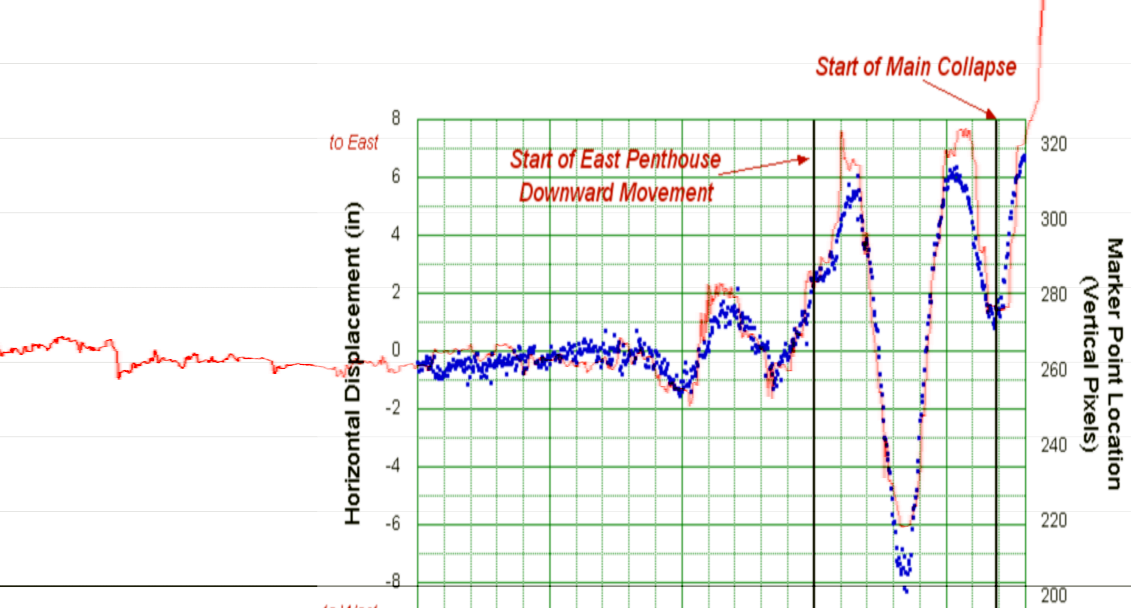
So you agree the building was in fact moving before the penthouse started to fall?[qimg]http://femr2.ucoz.com/_ph/7/655929457.png[/qimg]
Slightly extended time.
This is for the NW corner, rather than the NIST (pretty odd) moire method pixel on the NW edge, so the movement is slightly different. Abtirary vertical scaling.
So you agree the building was in fact moving before the penthouse started to fall?
Of course.
As I've said many times, one of the benefits of the high-fidelity tracing technique is to show what did occur, not what may have.
NW corner movement ~7s in advance of East Penthouse movement.
DGM
Skeptic not Atheist
It will be interesting to see if someday we could actually "see" the progression through the building.Of course.
As I've said many times, one of the benefits of the high-fidelity tracing technique is to show what did occur, not what may have.
NW corner movement ~7s in advance of East Penthouse movement.
")
It will be interesting to see if someday we could actually "see" the progression through the building.
The grid should be insightful.
However, it's possible to see some of the pre-descent behaviour without that...

I've previously presented thias asegment to folk such as tfk, but received nil in the way of response. Lots to see imo.
I'll be regenerating with the extended footage of course.
DGM
Skeptic not Atheist
I'm really not sure what I'm looking at here. (My eyesights not what it used to beThe grid should be insightful.
However, it's possible to see some of the pre-descent behaviour without that...
[qimg]http://femr2.ucoz.com/_ph/3/2/920361115.gif[/qimg]
I've previously presented thias asegment to folk such as tfk, but received nil in the way of response. Lots to see imo.
I'll be regenerating with the extended footage of course.
).I'm really not sure what I'm looking at here. (My eyesights not what it used to be
Motion traversal upwards nearish the middle (left to right) of the image.
I'll get round to annotating at some point.
Of course.
As I've said many times, one of the benefits of the high-fidelity tracing technique is to show what did occur, not what may have.
NW corner movement ~7s in advance of East Penthouse movement.
Gee, just like NIST said...
Imagine that.
DGM
Skeptic not Atheist
Not to mimic what tfk just said but wouldn't that concur with what NIST predicted in the simulations?Motion traversal upwards nearish the middle (left to right) of the image.
I'll get round to annotating at some point.
The grid should be insightful.
However, it's possible to see some of the pre-descent behaviour without that...
http://femr2.ucoz.com/_ph/3/2/920361115.gif
I've previously presented thias asegment to folk such as tfk, but received nil in the way of response. Lots to see imo.
I'll be regenerating with the extended footage of course.
You may have presented it, but I didn't bother with it.
It became clear to me that you were not interested in making your case clearly, but merely playing semantic games.
I got tired of your games.
My current assessment is that you have not made your case for significant sub-pixel resolution.
Some day, if you ever consolidate your stuff into a concise, comprehensible package, perhaps I'll look at it. But I wouldn't suggest that you count on it.
___
Meanwhile, why don't you reverse your usual tack of innuendo & murkiness & simply state clearly what you think constitutes the "lots to see" in this gif.
tk
Not to mimic what tfk just said but wouldn't that concur with what NIST predicted in the simulations?
It concurs with the visual trace they supplied (as posted above in the overlay with my data) but without access to full-length and full scale simulation visual data there's no way for me to confirm if it matches their model behaviour.
I don't think that's too relevant as the behaviour of the simulation is wildly different to the actual behaviour..
(I've used the NIST timing for *Start of East Penthouse Downward Movement*, so I'll need to check it.)
tfk,
As you are now citing my current Dan Rather data in other threads (which I assume you now therefore endorse), I'll let you know personally when the new data is available so that you are kept up to date.
Bad assumption.
Did you ever get your scaling factor for that video straightened out?
tk
Then stop citing it to support your arguments until you do.Bad assumption.
Did you ever get your scaling factor for that video straightened out?
tk
Not sure which scaling factor you mean. If you mean for WTC 7, it's as straight as available data allows. I'd like to make it *more* accurate, but without further facade metric data that's not possible.
DGM
Skeptic not Atheist
In light of this I think you might have to spend a lot more time defining "wildly".It concurs with the visual trace they supplied (as posted above in the overlay with my data) but without access to full-length and full scale simulation visual data there's no way for me to confirm if it matches their model behaviour.
I don't think that's too relevant as the behaviour of the simulation is wildly different to the actual behaviour..
(I've used the NIST timing for *Start of East Penthouse Downward Movement*, so I'll need to check it.)
In light of what ?In light of this
The behaviour of the global model bears no resemblance to the actual behaviour. Am sure you have seen the very short clips kicking around. Long versions not available afaik.I think you might have to spend a lot more time defining "wildly".
There's also the very short floor buckling animation (which is of course not visible from the outside), which does not show how it relates to east penthouse movement. (I have a copy kicking around. Can place inline if you want.)
jaydeehess
Penultimate Amazing
Hello all, again.
Just popping to to ask if a margin of error has ever been established for femr2's plots? If not then I'll pop back again in a few days or weeks to ask yet again.
Just popping to to ask if a margin of error has ever been established for femr2's plots? If not then I'll pop back again in a few days or weeks to ask yet again.
It depends upon which dataset, from which piece of footage.Hello all, again.
Just popping to to ask if a margin of error has ever been established for femr2's plots? If not then I'll pop back again in a few days or weeks to ask yet again.
The basic original Dan Rather viewpoint variance was suggested before the thread began, and repeated numerous times...
http://www.internationalskeptics.com/forums/showpost.php?p=6274848&postcount=224
Those skeptical can increase that to whatever they like as far as I'm concerned.a) position error, in pixels
Dan Rather footage - +/- 0.2 pixels
b) scaling metric error, in pixels/ft (footage dependant)
+/- 1 pixel
For WTC 7 there is limited building measurement data available, so with the caveat of accepting the scant NIST provided values...
Vertical scaling metric 3.41 to 3.47 ft/pixel
Horizontal scaling metric 1.64 to 1.66 ft/pixel
Note that these are global metrics over the full distance, and do not affect the positional error metric.
Scaling Metrics for the Cam#3 footage are of higher accuracy, as the footage is of higher quality and resolution (which is why I stated to tfk at the beginning of our discussion that I'd prefer to use that footage)
c) velocity error, in ft/s (footage dependant)
There has been no agreement of noise reduction or smoothing process. Until there is *some* agreement, it's too early to state.
d) acceleration error, in ft/s^2 (footage dependant)'
There has been no agreement of noise reduction or smoothing process. Until there is *some* agreement, it's too early to state.
It doesn't dramatically change any suggested data interpretations.
Bottom line is it's the most accurate and highest resolution data available.
The techniques are shown to detect movement at least matching the accuracy of the NIST moire method (which can only be used at one single point on the image, whereas my methods can be used almost anywhere within the frame)...
Note the vertical axis scale, in inches.
jaydeehess
Penultimate Amazing
c) velocity error, in ft/s (footage dependant)
There has been no agreement of noise reduction or smoothing process. Until there is *some* agreement, it's too early to state.
d) acceleration error, in ft/s^2 (footage dependant)'
There has been no agreement of noise reduction or smoothing process. Until there is *some* agreement, it's too early to state
So, given that velocity and acelleration ARE the important quantities here, the answer to my question above is still;
"No"
Inasmuch as the whole point of the exercise was to see if the structure could indeed be said to have fallen at (or above) an acelleration of 'g', without a margin of error for the values you arrive at they are still all but useless.
The wheels look like they are spinning but the vehicle is not moving.
Last edited:
No. Far from it. Personally I'm not particularly interested in the derived metrics (velocity/acceleration). It is the limited focus of others that may lead you to that incorrect assumption.So, given that velocity and acelleration ARE the important quantities here
See above.Inasmuch as the whole point of the exercise
As stated, the problem is the never-ending objection to suggested positional accuracy and methods for determining velocity and acceleration.was to see if the structure could indeed be said to have fallen at (or above) an acelleration of 'g', without a margin of error for the values you arrive at they are still all but useless.
If you're okay with +/- 0.2 pixels for the positional data, and the stated variance for scaling metric, there's not too much problem suggesting velocity and acceleration accuracy, though I'll be using smoothing methods of course, so the likes of tfk will probably have a bee in their bonnet...
My focus is more upon metrics using the positional data only, which includes things like the ability to state (with data) accurate timing for initial movement, relative inter-feature initial movements, ...that sort of thing.