Michael Mozina
Banned
- Joined
- Feb 10, 2009
- Messages
- 9,361
Why, Dr. Kosovichev's helioseismology research, of course.
Liar. Where's the paper? Nothing I ever presented anywhere on any forum supports your claim.
Why, Dr. Kosovichev's helioseismology research, of course.
And as a bit of a graphics expert myself,
I'm calling fraud. I think you've twiddled with a couple filters in PhotoShop to get something you think looks like running difference images.
I say you don't know what you're doing and you've faked it.
[*tantrum snipped*]

Produce it yourself.
There's a great deal of discussion on that particular issue here in this 2,700 post discussion.
Getting pretty close to done making those videos, Michael?
Liar. Where's the paper? Nothing I ever presented anywhere on any forum supports your claim.

Nope. I'm not your monkey on command. I'll produce a bunch of them for you when I'm ready. I may even do a few in Photoshop as well so I can stuff that BS down your throat too. Photoshop offers FITS file extensions, it's fully capable of adding intensity to an image and/or subtracting one image from another. You're full of it.
")
What you mean is nothing you ever presented anywhere on any forum supports your claim.
And obviously you've got lots of spare time on your hands. Certainly you've got those videos ready by now.
He never addresses the simple physics that the TRACE instrument in the 171A pass band can only see light from plasma at > 160,000 K.
FYI, I am the only one of the two of us to actually post a "real" running difference solar image. You may not like the four I've given you, but at least I've been man enough to post them for all the world to see and for idiots like you to bitch about. Where's your video for us to inspect, and how do I know that you personally created them? What software package(s) did you use?
You dont seem to understand the 171 pass band light reflects just like white light. You can see reflections from the structures using the 171A light.
[*Gibberish snipped.*]
Well, sure I could map it if I wanted to map a highly volcanic surface that's constantly changing over time. It's not all the productive in my experience.
I have in fact compared RD image surface features in SOHO images over a full rotation cycle (27.3 days) but even then there are obvious and sometimes significant changes over that timeline, particularly during active phases where the volcanic activity is constant and occurs all along the surface.
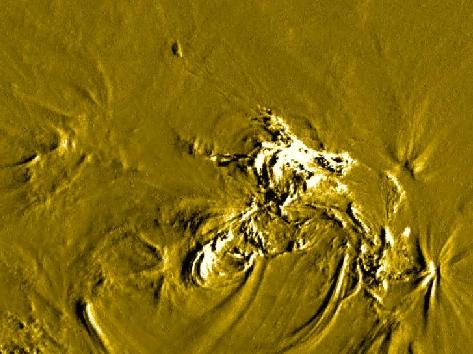
If you look closely at the gold RD LMSAL image, you'll actually see surface erosion along the bottom right hand side just after the main event due to the electrical processes that create the coronal loops. It literally "peals" particles from the surface and ionizes them in the loop. That electrical erosion process shows up in the RD images too, as you can see from the video. There are changes to the surface that occur for a variety of reasons, so any surface "maps" would need to be constantly updated.
You don't seem to understand. There are no structures for anything to reflect from.
[qimg]http://www.thesurfaceofthesun.com/images/171surfaceshotsmall.JPG[/qimg]
Ya, except for all the structures in the image.
How does a surface so volcanically active that it completely recreates itself on the scale of weeks to months ever have time to solidify?
And how can you see a solid surface in RD images, when the whole point of RD is to filter out the unchanging parts?
If that's RD, those are exactly the opposite of structures. They're changes.
[qimg]http://www.thesurfaceofthesun.com/images/171surfaceshotsmall.JPG[/qimg]
Ya, except for all the structures in the image.
It may not. Some parts probably never do. Some parts do however and those parts are a lot more 'persistent' timeline wise than any sort of plasma. The structures of the photosphere tend to come and go in roughly eight minutes or so. They don't show longevity over days and weeks like that. Even closeup images of sunspots show significant change around the edges of the penumbra of the sunspot during the image, regardless of the time frame we're talking about. Plasma simply isn't "rigid' and doesn't have properties necessary to explain these images.
Due to the motion of the sun between the two images that are used to create the RD image, and the fact the first image is modified in intensity before the second one is subtracted, it doesn't actually 'filter out' the unchanging parts as you might think.
The process "sort of" filters out some of the coronal loop activity itself, but the RD process reveals the overall outline of emission patterns. "Longevity" then depends on whether those emission patterns remain stable and consistent in their basic outline or they don't, not to mention the structures they reflect off of. Only if the light emissions remain consistent will the images remain consistent. If you were to do a RD image from a close-up GBAND image of the photosphere, you'd see all sorts of movements due to the movements of the structures in the original images. As long as the overall light/dark patterns are visually moving in the original images, you'll see that same movement play out in the RD images too. The iron ion wavelengths however show very consistent emission patterns from one frame to the next. That's why the RD images show persistent structures over time.
The overall surface terrain dictates the basic emission pattern. The rigidness of the light source demonstrate that something under the photosphere is much more rigid than the mobile plasma of the photosphere.
You don't seem to understand. There are no structures for anything to reflect from.