Tim Thompson
Muse
- Joined
- Dec 2, 2008
- Messages
- 969
The Transition Region
Exhibit 1
Solar XUV Limb Brightening Observations II: Lines Formed in the Chromospheric-Coronal Transition Region; George Withbroe, Solar Physics 11(2): 208-221, February 1970
Abstract: Limb brightening of XUV lines of the ions CIII NIII, NIV, OIII, OIV, OV and SiIV is compared with that predicted by a modified version of a coronal model developed by Dupree and Goldberg. Systematic differences between the predicted and observed limb brightening are found. These differences can be eliminated by introducing into the model the effects of spicules that extend up into the chromospheric-coronal transition region. The spicules are assumed to be opaque to radiation between 500 and 900 Å because of absorption in the hydrogen Lyman continuum.
Exhibit 2
Ultraviolet Studies of the Solar Atmosphere; Robert Noyes, Annual Review of Astronomy and Astrophysics 9: 209-236, 1971
No abstract, but a lengthy introduction. This paper concentrates on the transition region and explicitly shows the temperature profile of same in the very first figure of the paper, on page 210.
Quoting from page 223, under the heading "The Transition Zone": The transition region between the 104K chromosphere and the 106K corona is perhaps the most intriguing region of the observable solar atmosphere. It has become clear in recent years that this transition region is almost incredibly thin - the temperature rise from 105 to 2x10⁵K, for example, appears to take place over a distance of only about 20 km (see, e.g., Athay 1971). This sharp transition region immediately overlies the upper chromosphere, where large scale velocities are observed up to several times the chromospheric sound velocity, where vertical displacement of chromospheric material reaches 10,000 km in spicules, and where the influence of magnetic fields is suggested by the channeled flow of spicules (For a review of spicules and other dynamic phenomena in the upper chromosphere, see Beckers 1968). The steepness of the transition zone was already evident by the time of Goldberg's (1967) review, and we only summarize the main evidence here, referring the reader to that discussion and to Athay's recent review (1971) for details.
Exhibit 3
The Solar Chromosphere and Its Transition to the Corona; H. Frisch, Space Science Reviews 13(3): 455-483, July 1972
Abstract: Our present knowledge on the average physical properties of the chromosphere and of the transition region between chromosphere and corona is reviewed. It is recalled that shock wave dissipation is responsible for the high temperatures observed in the chromosphere and corona and that, due to the non-linear character of the dissipation mechanism, no satisfactory explanation of the structure of the outer solar layers has yet been given. In this paper, the main emphasis is on the observations and their interpretation. Evidence for the non-spherically symmetric structure of the atmosphere is given; the validity of interpreting the observations with the help of a fictitious spherically symmetric atmosphere is discussed. The chromosphere and the transition region are studied separately: for each region, the energy balance is considered and recent homogeneous models derived from ultra-violet, infrared and radio observations are discussed. It is stressed that although in the chromosphere, a study of the radiative losses may lead to the determination, as function of height, of the amount of mechanical energy dissipated as function of height, a more detailed analysis of the velocity field is necessary to find the periods and the wavelengths of the waves responsible for the heating. The methods used for wave detection and some results are presented. Observational and theoretical evidence is given for the non-validity of the assumption of hydrostatic equilibrium which is commonly used in modeling the transition region. We conclude that a better understanding of the heating mechanism will come through a higher spatial resolution (less than 0.2″) and more accurate absolute measurements, rather than from sophisticated hydrodynamical calculations.
Exhibit 4
Temperature Structure and Conductive Flux in the Chromosphere-Corona Transition Region; G. Elwert & P.K. Raju, Solar Physics
25(2): 319-328, August 1972
Abstract: Observations of UV-line intensities referring to the whole undisturbed Sun are used to investigate the chromosphere-corona transition region. For the evaluation of the integral representing the theoretical line intensities it appears to be an improvement to consider not the temperature gradient but the conductive flux to be nearly constant in the line-forming region. The variation of conductive flux with temperature calculated in this way is indeed small. Moreover, in the conductive flux versus temperature diagram the scatter of points is found to be less with coronal values of relative abundances than with photospheric ones. The results are used for determining the temperature structure of the transition region.
I submit the above exhibits, and the citations thereto, into evidence as a refutation of the unsubstantiated allegation that the location of the transition region was simply "assumed" prior to the launch of the TRACE mission. As the material given here shows, along with the full content of the referenced papers, the physics & location of the transition region was well developed more than 20 years before the launch of the TRACE mission. Rather than simply "assuming" a location for the transition region, scientists in fact had solid physical evidence, based on direct observations of the sun, that there was a transition region between the chromosphere and corona. Indeed, they had already derived not only the location of the transition region, but had already determined a temperature profile for it. I assert that the claim made by Mozina that this was all only "assumed" stands refuted.
Example (abstract only)
A new view of the solar outer atmosphere by the Transition Region and Coronal Explorer; C.J. Schrijver, et al., Solar Physics 187(2): 261-302, July 1999
Abstract: The Transition Region and Coronal Explorer (TRACE) described in the companion paper by Handy et al. (1999) provides an unprecedented view of the solar outer atmosphere. In this overview, we discuss the initial impressions gained from, and interpretations of, the first million images taken with TRACE. We address, among other topics, the fine structure of the corona, the larger-scale thermal trends, the evolution of the corona over quiet and active regions, the high incidence of chromospheric material dynamically embedded in the coronal environment, the dynamics and structure of the conductively dominated transition region between chromosphere and corona, loop oscillations and flows, and sunspot coronal loops. With TRACE we observe a corona that is extremely dynamic and full of flows and wave phenomena, in which loops evolve rapidly in temperature, with associated changes in density. This dynamic nature points to a high degree of spatio-temporal variability even under conditions that traditionally have been referred to as quiescent. This variability requires that coronal heating can turn on and off on a time scale of minutes or less along field-line bundles with cross sections at or below the instrumental resolution of 700 km. Loops seen at 171 Å (~1 MK) appear to meander through the coronal volume, but it is unclear whether this is caused by the evolution of the field or by the weaving of the heating through the coronal volume, shifting around for periods of up to a few tens of minutes and lighting up subsequent field lines. We discuss evidence that the heating occurs predominantly within the first 10 to 20 Mm from the loop footpoints. This causes the inner parts of active-region coronae to have a higher average temperature than the outer domains.
This first major review of results from the new TRACE spacecraft (launched April 1998) shows no sign of incompatibility or inconsistency with earlier studies of the transition region. One would think that, had the TRACE scientists seen that their data were not consistent with the very detailed knowledge of the transition region that has already been developed (see above), they would likely have mentioned it somewhere along the line. Or perhaps you will now claim a conspiracy to hide the transition region truth?
To begin with, the "footpoint" of the loop is defined to be where the loop intersects the photosphere, so you lose that one to the dictionary. Of course, we already know that the magnetic fields around sunspots and active regions penetrate deeply into the photosphere, so if that is a point you are trying to make, then you are working hard to convince people of something that everybody already knows. But if you are trying to argue that the 171Å emission comes from below the photosphere, you have failed rather miserably to do so. I point out that you have never been able to produce a single image that unambiguously supports your claim. What you are seeing is loops that penetrate the top of the chromosphere, and then assuming that they are in fact penetrating the photosphere.
So we come full circle. You claimed that the location of the transition region was a mere "assumption" prior to the launch of TRACE, but I have demonstrated that this is a false claim. In reality, you are the one doing the assuming around here, and with no physical justification at all. The only "justification" you can claim is your arbitrary, subjective and biased interpretation of the images you have. But since your claims very clearly violate the laws of physics, that trumps your wimpy images every time.
Transition Region and Coronal Explorer. What has that got to do with the temperature profile of the photosphere, which is derived from Earth based observations?
Really? Assumed? Well, let's test that hypothesis. The TRACE mission launched from Vandenberg AFB in April 1998. So, what was known about the transition region before the spacecraft launched? Was it all just some simple "assumption", or were there valid physical reasons for expecting a transition region between the chromosphere and corona?The point Tim is that they *ASSUMED* before they took their first picture of the sun that there was some magical upper atmospheric "region" where a "transition" occurred in the plasma as though it were some layer far above the photosphere, somewhere between the lower corona/upper chromosphere. They *ASSUMED* a location Tim.
Exhibit 1
Solar XUV Limb Brightening Observations II: Lines Formed in the Chromospheric-Coronal Transition Region; George Withbroe, Solar Physics 11(2): 208-221, February 1970
Abstract: Limb brightening of XUV lines of the ions CIII NIII, NIV, OIII, OIV, OV and SiIV is compared with that predicted by a modified version of a coronal model developed by Dupree and Goldberg. Systematic differences between the predicted and observed limb brightening are found. These differences can be eliminated by introducing into the model the effects of spicules that extend up into the chromospheric-coronal transition region. The spicules are assumed to be opaque to radiation between 500 and 900 Å because of absorption in the hydrogen Lyman continuum.
Exhibit 2
Ultraviolet Studies of the Solar Atmosphere; Robert Noyes, Annual Review of Astronomy and Astrophysics 9: 209-236, 1971
No abstract, but a lengthy introduction. This paper concentrates on the transition region and explicitly shows the temperature profile of same in the very first figure of the paper, on page 210.
Quoting from page 223, under the heading "The Transition Zone": The transition region between the 104K chromosphere and the 106K corona is perhaps the most intriguing region of the observable solar atmosphere. It has become clear in recent years that this transition region is almost incredibly thin - the temperature rise from 105 to 2x10⁵K, for example, appears to take place over a distance of only about 20 km (see, e.g., Athay 1971). This sharp transition region immediately overlies the upper chromosphere, where large scale velocities are observed up to several times the chromospheric sound velocity, where vertical displacement of chromospheric material reaches 10,000 km in spicules, and where the influence of magnetic fields is suggested by the channeled flow of spicules (For a review of spicules and other dynamic phenomena in the upper chromosphere, see Beckers 1968). The steepness of the transition zone was already evident by the time of Goldberg's (1967) review, and we only summarize the main evidence here, referring the reader to that discussion and to Athay's recent review (1971) for details.
Exhibit 3
The Solar Chromosphere and Its Transition to the Corona; H. Frisch, Space Science Reviews 13(3): 455-483, July 1972
Abstract: Our present knowledge on the average physical properties of the chromosphere and of the transition region between chromosphere and corona is reviewed. It is recalled that shock wave dissipation is responsible for the high temperatures observed in the chromosphere and corona and that, due to the non-linear character of the dissipation mechanism, no satisfactory explanation of the structure of the outer solar layers has yet been given. In this paper, the main emphasis is on the observations and their interpretation. Evidence for the non-spherically symmetric structure of the atmosphere is given; the validity of interpreting the observations with the help of a fictitious spherically symmetric atmosphere is discussed. The chromosphere and the transition region are studied separately: for each region, the energy balance is considered and recent homogeneous models derived from ultra-violet, infrared and radio observations are discussed. It is stressed that although in the chromosphere, a study of the radiative losses may lead to the determination, as function of height, of the amount of mechanical energy dissipated as function of height, a more detailed analysis of the velocity field is necessary to find the periods and the wavelengths of the waves responsible for the heating. The methods used for wave detection and some results are presented. Observational and theoretical evidence is given for the non-validity of the assumption of hydrostatic equilibrium which is commonly used in modeling the transition region. We conclude that a better understanding of the heating mechanism will come through a higher spatial resolution (less than 0.2″) and more accurate absolute measurements, rather than from sophisticated hydrodynamical calculations.
Exhibit 4
Temperature Structure and Conductive Flux in the Chromosphere-Corona Transition Region; G. Elwert & P.K. Raju, Solar Physics
25(2): 319-328, August 1972
Abstract: Observations of UV-line intensities referring to the whole undisturbed Sun are used to investigate the chromosphere-corona transition region. For the evaluation of the integral representing the theoretical line intensities it appears to be an improvement to consider not the temperature gradient but the conductive flux to be nearly constant in the line-forming region. The variation of conductive flux with temperature calculated in this way is indeed small. Moreover, in the conductive flux versus temperature diagram the scatter of points is found to be less with coronal values of relative abundances than with photospheric ones. The results are used for determining the temperature structure of the transition region.
I submit the above exhibits, and the citations thereto, into evidence as a refutation of the unsubstantiated allegation that the location of the transition region was simply "assumed" prior to the launch of the TRACE mission. As the material given here shows, along with the full content of the referenced papers, the physics & location of the transition region was well developed more than 20 years before the launch of the TRACE mission. Rather than simply "assuming" a location for the transition region, scientists in fact had solid physical evidence, based on direct observations of the sun, that there was a transition region between the chromosphere and corona. Indeed, they had already derived not only the location of the transition region, but had already determined a temperature profile for it. I assert that the claim made by Mozina that this was all only "assumed" stands refuted.
This unsubstantiated claim is itself not at all consistent with the published track record of the TRACE mission, as well as other transition region studies.What they "observed" doesn't fit that model, not even slightly.
Example (abstract only)
A new view of the solar outer atmosphere by the Transition Region and Coronal Explorer; C.J. Schrijver, et al., Solar Physics 187(2): 261-302, July 1999
Abstract: The Transition Region and Coronal Explorer (TRACE) described in the companion paper by Handy et al. (1999) provides an unprecedented view of the solar outer atmosphere. In this overview, we discuss the initial impressions gained from, and interpretations of, the first million images taken with TRACE. We address, among other topics, the fine structure of the corona, the larger-scale thermal trends, the evolution of the corona over quiet and active regions, the high incidence of chromospheric material dynamically embedded in the coronal environment, the dynamics and structure of the conductively dominated transition region between chromosphere and corona, loop oscillations and flows, and sunspot coronal loops. With TRACE we observe a corona that is extremely dynamic and full of flows and wave phenomena, in which loops evolve rapidly in temperature, with associated changes in density. This dynamic nature points to a high degree of spatio-temporal variability even under conditions that traditionally have been referred to as quiescent. This variability requires that coronal heating can turn on and off on a time scale of minutes or less along field-line bundles with cross sections at or below the instrumental resolution of 700 km. Loops seen at 171 Å (~1 MK) appear to meander through the coronal volume, but it is unclear whether this is caused by the evolution of the field or by the weaving of the heating through the coronal volume, shifting around for periods of up to a few tens of minutes and lighting up subsequent field lines. We discuss evidence that the heating occurs predominantly within the first 10 to 20 Mm from the loop footpoints. This causes the inner parts of active-region coronae to have a higher average temperature than the outer domains.
This first major review of results from the new TRACE spacecraft (launched April 1998) shows no sign of incompatibility or inconsistency with earlier studies of the transition region. One would think that, had the TRACE scientists seen that their data were not consistent with the very detailed knowledge of the transition region that has already been developed (see above), they would likely have mentioned it somewhere along the line. Or perhaps you will now claim a conspiracy to hide the transition region truth?
In fact the 171A footprints *DO NOT* originate in some mythical "transition region" above the photosphere as they *ASSUMED* before launch, but actually they originate *UNDER* the photosphere. They've never abandoned their flawed assumption even though the images blow their "transition region" theory out of the water. The loops span the whole atmosphere Tim, from the "surface" far below the photosphere, to way into the corona. They aren't limited to a singular magical "transition region", they are ordinary discharges occurring throughout the whole atmosphere.
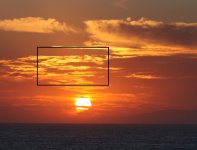
Well, the white light images and the TRACE 171Å images do not show the same physical material. You are seriously misinterpreting the images, to the point of being quite silly about it really.The certainly originate below the photosphere Tim as I was attempting to demonstrate to you with that white light image.
To begin with, the "footpoint" of the loop is defined to be where the loop intersects the photosphere, so you lose that one to the dictionary. Of course, we already know that the magnetic fields around sunspots and active regions penetrate deeply into the photosphere, so if that is a point you are trying to make, then you are working hard to convince people of something that everybody already knows. But if you are trying to argue that the 171Å emission comes from below the photosphere, you have failed rather miserably to do so. I point out that you have never been able to produce a single image that unambiguously supports your claim. What you are seeing is loops that penetrate the top of the chromosphere, and then assuming that they are in fact penetrating the photosphere.
So we come full circle. You claimed that the location of the transition region was a mere "assumption" prior to the launch of TRACE, but I have demonstrated that this is a false claim. In reality, you are the one doing the assuming around here, and with no physical justification at all. The only "justification" you can claim is your arbitrary, subjective and biased interpretation of the images you have. But since your claims very clearly violate the laws of physics, that trumps your wimpy images every time.
")


")