You are using an out of date browser. It may not display this or other websites correctly.
You should upgrade or use an alternative browser.
You should upgrade or use an alternative browser.
Global Cooling in 2009 (375 Sources)
- Thread starter Poptech
- Start date

lomiller
Penultimate Amazing
- Joined
- Jul 31, 2007
- Messages
- 13,208
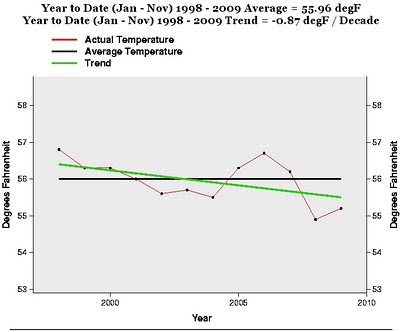
Well, if mainstream climate science models computed in the late 90s predicted a steady rise in temperatures over the following ten years, it might be interesting to compare actual measurements over those ten years to the model predictions.
realclimate has a recent model-observation comparison here
http://www.realclimate.org/index.php/archives/2009/12/updates-to-model-data-comparisons/
Sorry but only official NCDC data was used. The graph is 100% real.Yeah, what's with that, its one thing to misrepresent data and graphs but to outright manufacture fraudulent data and misrepresent it as official data, just seems like an offense that deserves more than a head shake and exposure.
2009 - Coldest day since 1953 (The Cairns Post, Australia, March 31, 2009)Australia had a very hot year, and some of the warmest months on record.
2009 - New Australian continent wide low temperature record set for April (Watts Up With That?, April 29, 2009)
2009 - Australian Ski Resort has it's earliest start to the season in the resort's 45-year history (ABC News, Australia, April 30, 2009)
2009 - Melbourne shivers through coldest April in 60 years (Herald Sun, Australia, April 30, 2009)
2009 - Record cold hits Far North breaks 113 year record in the Cooktown region (The Cairns Post, Australia, May 23, 2009)
2009 - Red Centre shivers in record cold (ABC News, Australia, June 1, 2009)
2009 - Coldest day for 43 years (The Australian, June 13, 2009)
Well, if mainstream climate science models computed in the late 90s predicted a steady rise in temperatures over the following ten years, it might be interesting to compare actual measurements over those ten years to the model predictions.
Trend Analysis of Satellite Global Temperature Data (PDF)
(Energy & Environment, Volume 20, Number 7, pp. 1087-1098, November 2009)
- Craig Loehle
So much for the models. Though Gavin will make sure to make the necessary "adjustments".Analysis of the satellite data shows a statistically significant cooling trend for the past 12 to 13 years, with it not being possible to reject a flat trend (0 slope) for 16 years. This is a length of time at which disagreement with climate models can no longer be attributed to simple LTP. On the other hand, studies cited herein have documented a 50-70 year cycle of climate oscillations overlaid on a simple linear warming trend since the mid-1800s and have used this model to forecast cooling beginning between 2001 and 2010, a prediction that seems to be upheld by the satellite and ocean heat content data. Other studies made this same prediction of transition to cooling based on solar activity indices or from ocean circulation regime changes. In contrast, the climate models predict the recent flat to cooling trend only as a rare stochastic event. The linear warming trend in these models that is obtained by subtracting the 60-70 yr cycle, while unexplained at present, is clearly inconsistent with climate model predictions because it begins too soon (before greenhouse gases were elevated) and does not accelerate as greenhouse gases continue to accumulate. This model and the empirical evidence for recent cooling thus provide a challenge to climate model accuracy.
paximperium
Penultimate Amazing
- Joined
- May 30, 2008
- Messages
- 10,696
Strange. I can use NCDC graph maker as well!!!

Everyone go here: http://www.ncdc.noaa.gov/oa/climate/research/cag3/cag3.html
and play!!! Make up your own graph!!!
Everyone go here: http://www.ncdc.noaa.gov/oa/climate/research/cag3/cag3.html
and play!!! Make up your own graph!!!
BenBurch
Gatekeeper of The Left
It would appear that is not the same data set at all.
The Painter
Banned
- Joined
- Apr 17, 2006
- Messages
- 2,654
Why do all the "believers" rush to bash anyone who disagrees with them??? Why are people who disagree called "deniers"? It's almost like saying Jesus is not real and all the "believers" come rushing in to repel the attack of the deniers.
Someones data could be wrong. The only one whose data has been shown to have been tampered with is the "believers" data.
In my life I have seen predictions of impending ice age and firestorms. I think I will be a skeptic on this issue. I have yet to be convinced. Yes the "believers" will now call me a "denier". I can live with that.
So you admit you changed the data? Now you are just like the "climategate" people.
Someones data could be wrong. The only one whose data has been shown to have been tampered with is the "believers" data.
In my life I have seen predictions of impending ice age and firestorms. I think I will be a skeptic on this issue. I have yet to be convinced. Yes the "believers" will now call me a "denier". I can live with that.
Strange. I can use NCDC graph maker as well!!!
[qimg]http://climvis.ncdc.noaa.gov/tmp/graph-Jan418:04:482144470214.gif[/qimg]
Everyone go here: http://www.ncdc.noaa.gov/oa/climate/research/cag3/cag3.html
and play!!! Make up your own graph!!!
So you admit you changed the data? Now you are just like the "climategate" people.
Last edited:
TellyKNeasuss
Illuminator
- Joined
- Oct 4, 2006
- Messages
- 3,798
So you admit you changed the data?
He/she picked a different start year. This really isn't all that complicated.
mhaze
Banned
- Joined
- Jan 10, 2007
- Messages
- 15,718
Where were the "firestorms" predictions? Nuclear? But let me add to that: Y2K, one kinda flu, another kinda flu, and yet another kinda flu, and the last go round of Global Cooling.Why do all the "believers" rush to bash anyone who disagrees with them??? Why are people who disagree called "deniers"? It's almost like saying Jesus is not real and all the "believers" come rushing in to repel the attack of the deniers.
Someones data could be wrong. The only one whose data has been shown to have been tampered with is the "believers" data.
In my life I have seen predictions of impending ice age and firestorms. I think I will be a skeptic on this issue. I have yet to be convinced. Yes the "believers" will now call me a "denier". I can live with that.
So you admit you changed the data? Now you are just like the "climategate" people.
It's time for the KoolAid Warmer crowd to get on the Global Kooling bandwagon! There's still time, get in the game early. Be the first on your block to shrilly proclaim a New Belief!
Strange. I can use NCDC graph maker as well!!!
It's a strange graph all right. A subtle negative trend from 1980 to 1997, a massive step change then a subtle negative trend after that.
Not at all like other graphs from that period. What is this - US surface temps?
casebro
Penultimate Amazing
- Joined
- Jun 14, 2005
- Messages
- 19,788
Well, if you are predictng future trends, shouldn't you weight the the current data heavier than say 200 year old data? The last decade rather than the 1930s?
IF there is going to be a cooling trend as part of the normal non-A cycle, then it has to start at the warmest year, doesn't it?
I don't recall anybody saying the "warming is over" in 2000. But a decade later? Now it seems reasonable to me.
Well warmers, don't you have to at least admit to a leveling off?
Off course, now you'll move the goal posts with the claim that the temp is not up, but the "overall heat content in terra calories" is....
mhaze
Banned
- Joined
- Jan 10, 2007
- Messages
- 15,718
Rats. I was kind of hoping it'd be "But the hockey stick Is Real!"....now you'll move the goal posts with the claim that the temp is not up, but the "overall heat content in terra calories" is....
shadron
Philosopher
- Joined
- Sep 2, 2005
- Messages
- 5,918
It would appear that is not the same data set at all.
Seems to be some differences in the relative average temps in the 2000 region, doesn't there? Interesting.
150% guaranteed it is the NCDC dataset. Pax cropped the top of his graph to hide theBenBurch said:It would appear that is not the same data set at all.
What else would you expect from 21st century cooling deniers?Off course, now you'll move the goal posts with the claim that the temp is not up, but the "overall heat content in terra calories" is....
Last edited:
Trakar
Penultimate Amazing
- Joined
- Oct 20, 2007
- Messages
- 12,637
Sorry but only official NCDC data was used. The graph is 100% real.
Then provide a NCDC website link to the graph.
shadron
Philosopher
- Joined
- Sep 2, 2005
- Messages
- 5,918
Well, if you are predictng future trends, shouldn't you weight the the current data heavier than say 200 year old data? The last decade rather than the 1930s?
No. The significance of the data is in the average trend, not in any weighted scenario. You have to always justify weighting, and in these scenarios we want to know what is happening, not what is predicted to happen next, which may be one possible (but implausible) reason to weight recent temps higher.
IF there is going to be a cooling trend as part of the normal non-A cycle, then it has to start at the warmest year, doesn't it?
No. Trends are trends. I am not a stat person (though I've had plenty of stochastic process courses) but you don't start trends at anomalous data points, and 1998 is one of those. As a matter of fact, a linear trend is a foolish idea in any case, because the processes are likely much more complicated than linear, but I'm not sure what is more appropriate; perhaps simply smoothing is more appropriate.
I don't recall anybody saying the "warming is over" in 2000. But a decade later? Now it seems reasonable to me.
Well warmers, don't you have to at least admit to a leveling off?
Over the last ten years, perhaps, but again that is an average, and there are reasons for it (having to do with the sun and El/La Ninx.
Off course, now you'll move the goal posts with the claim that the temp is not up, but the "overall heat content in terra calories" is....
That's certainly off course, as you say. Did you see the graph above concerning ice melting? I don't see that slowing down (and, of course, I wouldn't expect to, not for quite a while longer, and only if your cooler's "leveling off" continues, say, another 30 or 40 years).
In the words of Ben Santer,Then provide a NCDC website link to the graph.
"I see no reason why I should do your work for you, and provide you with... which you can easily compute yourself."
shadron
Philosopher
- Joined
- Sep 2, 2005
- Messages
- 5,918
In the words of Ben Santer,
"I see no reason why I should do your work for you, and provide you with... which you can easily compute yourself."
Sure, OK. We know you aren't in search of the truth anyway, so that figures.
Trakar
Penultimate Amazing
- Joined
- Oct 20, 2007
- Messages
- 12,637
In the words of Ben Santer,
"I see no reason why I should do your work for you, and provide you with... which you can easily compute yourself."
Your lies, your obligation to support
properly support your assertions or acknowledge that they are the bung clingings they appear to be.
TellyKNeasuss
Illuminator
- Joined
- Oct 4, 2006
- Messages
- 3,798
150% guaranteed it is the NCDC dataset. Pax cropped the top of his graph to hide thedeclinedifference.
Actually, paximperium ended his/her graph at 2008, which was cooler than 2009. If paximperium was trying to "hide the decline", why did he/she not including a year that was warmer than the previous year?
Anyway, is there a reason why you are drawing your conclusion based on US data rather than global data?
Last edited: