Global Cooling in 2009 (375 Sources)

Poptech

Banned
Joined
Jun 19, 2009
Messages
1,258
Global Cooling in 2009

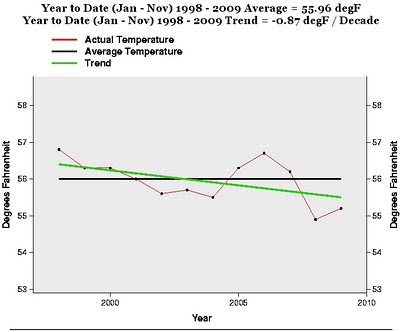
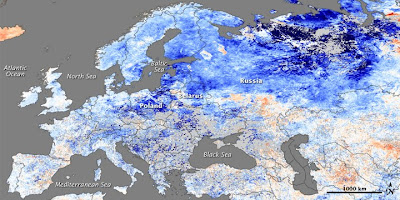
2009 was another year of global cooling, which saw numerous low temperature and high snowfall records smashed. The Dutch canals froze over for the first time in 12 years, record cold came to Al Gore's home town and ironically a blizzard dumped snow on the Copenhagen convention where world leaders met to try and stop global warming. It was so cold that even the BBC was forced to ask, what happened to global warming? As Climategate would reveal, IPCC scientists had been hard at work hiding evidence of global cooling. Yet the observational evidence cannot be ignored.


National Climatic Data Center​
1998-2009+Temperatures.jpg


Deadly Cold Across Europe and Russia

Dangerous+cooling.jpg

"The fact is that we can't account for the lack of warming at the moment and it is a travesty that we can't."
- Kevin Trenberth, Lead Author IPCC (2001, 2007)

So much for the hysteria!
 
Last edited:
Finland had the warmest year in it's recorded history...as well as the warmest decade...

:catfight:
 
Sure is a nice graph, PT. But tell me, why just eleven years? Why not, say, fifteen, or a nice round twenty? Surely a longer time base would make for a more significant trend, wouldn't you think?

Oh, well, just me being hysterical. :rolleyes:
 
So much for the hysteria!

indeed!

Global land and ocean annual surface temperatures through October are the fifth warmest on record, at 0.56 °C (1.01 °F) above the long-term average.
NOAA scientists project 2009 will be one of the 10 warmest years of the global surface temperature record, and likely finish as the fourth, fifth or sixth warmest year on record.
The 2000-2009 decade will be the warmest on record, with its average global surface temperature about 0.54 °C (0.96 °F) above the 20th Century average. This will easily surpass the 1990s value of 0.36 °C (0.65 °F).
Ocean surface temperatures (through October) were the sixth warmest on record, at 0.47 °C (0.85 °F) above the 20th century average.
Land surface temperatures through October were the fifth warmest on record, at 0.80 °C (1.44 °F) above the 20th century average.

http://www.ncdc.noaa.gov/sotc/?report=global&year=2009&month=13&submitted=Get+Report
 
Sure is a nice graph, PT. But tell me, why just eleven years? Why not, say, fifteen, or a nice round twenty? Surely a longer time base would make for a more significant trend, wouldn't you think?

Oh, well, just me being hysterical. :rolleyes:

There is also the issue of attribution. It looks like PT has made the graph himself and slapped a NCDC label on it. As for the rest, it looks like he’s accumulated a bunch of irrelevant references and some anecdotal evidence of local winter weather, in winter! no less.
 
There is also the issue of attribution. It looks like PT has made the graph himself and slapped a NCDC label on it. As for the rest, it looks like he’s accumulated a bunch of irrelevant references and some anecdotal evidence of local winter weather, in winter! no less.

Yeah, what's with that, its one thing to misrepresent data and graphs but to outright manufacture fraudulent data and misrepresent it as official data, just seems like an offense that deserves more than a head shake and exposure.
 
Yeah, what's with that, its one thing to misrepresent data and graphs but to outright manufacture fraudulent data and misrepresent it as official data, just seems like an offense that deserves more than a head shake and exposure.
Refreshingly familiar, Calvinisticly myopic, nervously stuttering:

the barking dogs of Warmerdom encounter a threat outside their little fenced yard.
 
This might be a new low for climate denialism, but I'd need somebody to graph it for me to be sure.
 
The reason for computing a trend beginning with 1998 was?
Well, if mainstream climate science models computed in the late 90s predicted a steady rise in temperatures over the following ten years, it might be interesting to compare actual measurements over those ten years to the model predictions.

I don't know if that was poptech's reason for computing this trend, though, or even if such model predictions actually exist to compare against. What did mainstream climate scientists predict, back in 1998, for the first decade of the new millenium, anyway?
 
There is also the issue of attribution. It looks like PT has made the graph himself and slapped a NCDC label on it. As for the rest, it looks like he’s accumulated a bunch of irrelevant references and some anecdotal evidence of local winter weather, in winter! no less.

And what are the data values? Are they US only? Europe only? Land only?
 
Well, if mainstream climate science models computed in the late 90s predicted a steady rise in temperatures over the following ten years, it might be interesting to compare actual measurements over those ten years to the model predictions.

I don't know if that was poptech's reason for computing this trend, though, or even if such model predictions actually exist to compare against. What did mainstream climate scientists predict, back in 1998, for the first decade of the new millenium, anyway?

Climate is not an issue of steady annual rises or declines, so no model that projected such would be an accurate or representative model. What the climate models of the 90s demonstrated, was that there had been a trend of rising temperatures, and that based upon the parameters of those models, projections of that trend indicated an average increase in temps over climate significant periods.
 
Global Cooling in 2009


National Climatic Data Center​
[qimg]http://1.bp.blogspot.com/_BsNAUboeko4/S0FrGNi9N-I/AAAAAAAAAQE/E-efKZ_NXQs/s400/1998-2009+Temperatures.jpg[/qimg]

Deadly Cold Across Europe and Russia

[qimg]http://2.bp.blogspot.com/_BsNAUboeko4/S0AXozmInoI/AAAAAAAAAP0/xQNKzLA3KjA/s400/Dangerous+cooling.jpg[/qimg]​


So much for the hysteria!


Wouldn't it show much more cooling if the graph included all the month's of December?

I mean December is the coldest month usually in the north anyhow.
 
Well, if mainstream climate science models computed in the late 90s predicted a steady rise in temperatures over the following ten years, it might be interesting to compare actual measurements over those ten years to the model predictions.

I don't know if that was poptech's reason for computing this trend, though, or even if such model predictions actually exist to compare against. What did mainstream climate scientists predict, back in 1998, for the first decade of the new millenium, anyway?

OK, then, why eleven years rather than the ten you think might be appropriate? He is well aware, as is (I'll say "most" for your sake) everyone here, why he decided to use 1998 as his start year. The fact is that his trend would show less of a negative slope for any other year besides that one, and if he'd gone to 15 years or more it would have been positive.

I went and looked on NCDC's site to see the actual numbers, but I couldn't find the relevant data. I did find interactive graphs for monthly data, but because of the annual rises and falls the yearly averages weren't clear. Choosing a particular month (say, avergaes for August every year for twenty years) the graphs seemed to have decidedly positive trends for 15 years intervals regardless of the month, though the trend varied a lot. If, as suggested above, PT would cite his references for the temperatures, then we could simultaneously determine the quality of his data as well as the quality of what appears to be his cherry-pick.


Even if you start in 1998, if you use annual averages, there is no declining trend.
 

Back
Top Bottom