Merged Thread to Discuss The Excellent Analysis of Jones latest paper

I have a short question regarding Jones' paper:

He (they...) go on about how the samples were collected just after the attacks. However, none of the samples were handled by people who know how to handle samples until some five to seven years after the event:


  • Sample one was given to Jones november 15, 2007
  • Sample two february 2, 2008
  • Sample threee. also february 2, 2008
  • Sample flour, november 2006.
Now its been a few years since I did any paper-writing but to me this sounds like a serious breach of protocol. Plus the fact that since the samples were collected by individuals and sent to Jones, there is no way of knowing how representative they are of the composition of the entire complex. None the less, they find nanothermite in one hundred procent of the samples. What are the odds of that?
 
Figure G.1b - 50 nm Al + MoO3 DSC Curves, p. 199 (p. 220, total) in Granier's dissertation, COMBUSTION CHARACTERISTICS OF A1 NANOPARTICLES AND NANOCOMPOSITE A1+MoO3 THERMITES, shows peaks from 511 C to 525 C (the green, 20 Kpm peak is off the chart), and onset from 419.4 C to 451 C.

I don't see any endotherms, at all.


Notice that Harrit's peak is at ~ 430 C - if their sample is, indeed, nanothermite, it appears that the morphology has made the oxide layer easier to crack, apparently at about the same temperature as what I'll presume are defective spherical oxide shells, would crack at.

I don't think that it's not absolutely necessary that the Al melt before the Al oxide layer crack. The Al will expand even before it becomes liquid, no?

What's this ?

Nouvelle image.jpg
 
Figure G.1b - 50 nm Al + MoO3 DSC Curves, p. 199 (p. 220, total) in Granier's dissertation, COMBUSTION CHARACTERISTICS OF A1 NANOPARTICLES AND NANOCOMPOSITE A1+MoO3 THERMITES, shows peaks from 511 C to 525 C (the green, 20 Kpm peak is off the chart), and onset from 419.4 C to 451 C.

I don't see any endotherms, at all.

I need to clarify or correct this. There are no peaks of negative magnitude (which are readily observable in other aluminothermic DSC's). However, there are dips approaching 660, such that the DSC plot is still positive in magnitude, which I can observe for 3 of the 5 readings (done at different Kelvins per minute). The data for the 20 Kpm plot terminates before 660, but it's magnitude is almost zero far from 660 - make of that what you will.

There's a very obvious dependence of existence/magnitude/sign of endotherms in Granier's DSC plots on Al size. Viz., the smaller the Al size, the less of an endotherm at 660, which can't even be seen for the case of 50 nm Al, 5 Kpm (though that may be because of obstruction by the other plots). This is to be expected, since the main reaction exotherm shifts from after the Al melting endotherm to before the Al melting endotherm. If you consume your Al at a temperature lower than it takes to melt it, it's simply not going to be there (in elemental form) to create an endotherm.

Also, for the smaller Al nanothermites, a dip at 660 C does not make the sample, as a whole, have a negative reading.

You can see this for yourself by studying the following in Granier:

p. 199 (220 total) has DSC for 50 nm Al + MoO3
p. 200 (221 total) has DSC for 80 nm Al + MoO3
p. 201 (222 total) has DSC for 120 nm Al + MoO3
p. 202 (223 total) has DSC for 1-3μm Al + MoO3
p. 204 (225 total) has DSC for 3-4μm Al + MoO3

It's certainly plausible that for 10 and 20μm-Al, which Granier worked with but doesn't show DSC's for, that the there is no noticeable dip at 660 C.

I don't think that it's not absolutely necessary that the Al melt before the Al oxide layer crack. The Al will expand even before it becomes liquid, no?
This should have been:

I don't think that it's not absolutely necessary that the Al melt before the Al oxide layer crack. The Al will expand even before it becomes liquid, no?


===================

Figure E.1a – 50nm Al + O2 DSC/TGA Curves (5Kpm), in Granier p. 174 (p 195, total) shows no exotherm at 660, at all. Apparently, gaseous O2 allows for a more thorough burning of Al. As the Harrit DSC was done in air, the oxygen present may have obliterated any chance to observe even a miniscule dip at 660 C.


===================

I hadn't noticed this, earlier, but Figure G.1b - 50 nm Al + MoO3 DSC Curves on p. 199 gives values for energy density for the same type of Al + MoO3 aluminothermic which varies by a factor of close to 2 - viz., 1885 J/g, 2016 J/g, 2354 J/g, and 3276 J/g. The only variable was temperature rate increase.
 
Figure E.1a – 50nm Al + O2 DSC/TGA Curves (5Kpm), in Granier p. 174 (p 195, total) shows no exotherm at 660, at all. .

This should have been:

Figure E.1a – 50nm Al + O2 DSC/TGA Curves (5Kpm), in Granier p. 174 (p 195, total) shows no endotherm at 660, at all.

1617649f57cd123a77.png
 
There's a very obvious dependence of existence/magnitude/sign of endotherms in Granier's DSC plots on Al size. Viz., the smaller the Al size, the less of an endotherm at 660, which can't even be seen for the case of 50 nm Al, 5 Kpm (though that may be because of obstruction by the other plots). This is to be expected, since the main reaction exotherm shifts from after the Al melting endotherm to before the Al melting endotherm. If you consume your Al at a temperature lower than it takes to melt it, it's simply not going to be there (in elemental form) to create an endotherm.

Also, for the smaller Al nanothermites, a dip at 660 C does not make the sample, as a whole, have a negative reading.

You can see this for yourself by studying the following in Granier:

p. 199 (220 total) has DSC for 50 nm Al + MoO3
p. 200 (221 total) has DSC for 80 nm Al + MoO3
p. 201 (222 total) has DSC for 120 nm Al + MoO3
p. 202 (223 total) has DSC for 1-3μm Al + MoO3
p. 204 (225 total) has DSC for 3-4μm Al + MoO3

It's certainly plausible that for 10 and 20μm-Al, which Granier worked with but doesn't show DSC's for, that the there is no noticeable dip at 660 C.

Here are 3 of the 5 DSC plots that I referred to. Topmost is 50 nm Al, middle is 120 nm Al, bottom is 3-4μm Al. I have added a vertical bar at about 660 C to all of these plots. Does anybody seriously doubt that at 20 nm Al, no endotherm will be noticeable; and even if it were visible in a vaccuum or inert gas DSC, it would not be noticeable in a DSC test like that done be Harrit, et. al., with O2 gas present?

1617649f587a3a0163.png
 
Metamars : does anybody seriously see 50 or 20 nm Al here ?

Chips_Jones.jpg


(from Harrit and al.)


and Figure 5.8 shows that endothermic peak is more important for 40 nm than 50 nm...
 
Last edited:
I understand that Iron can be melted in a furnace where the heat can accumulate and be concentrated but can a small piece of coal, dimension less than 100 microns melt a somewhat smaller piece of iron? i would say of course not since the dissipative process are much too effective at such small scales! So if you admit that some microspheres which are mostly iron (see Fig 21 and Fig 20) were produced from the chips in the DSC, what else than the reduction of Fe and oxydation of Al (released heat initially concentrated in the reactants ) could be responsible for that ? I can only explain this melted iron provided it participated in the reaction.
I have no sufficient chemical background to evaluate this, but I recall having seen that slight variations in the composition of a material (with respect to the total percentage of iron in it) can make broad differences in the melting point.

For example, structural steel is mostly iron, yet the melting point of steel can vary significantly depending on the type. In the "Structural steel" entry of Wikipedia there's a section called Thermal properties which explains how the melting point can vary from 1130°C to about 1539°C, depending apparently on the amount of carbon, if I interpret it correctly.

Isn't it the case, maybe, that some hint on the melting point of these spheres should be provided before taking the step of considering it anomalous?

It has already been pointed out by Dave Rogers that these iron- and oxygen-rich spheres can be produced by other reactions. Shouldn't this be ruled out before advancing in other hypotheses?
 
a very interesting paper about thermite :

Texas Tech University, Charles Crane, May 2009 A Thesis In MECHANICAL ENGINEERING Submitted to the Graduate Faculty of Texas Tech University in Partial Fulfillment of the Requirements for the Degree of MASTER OF SCIENCES
v
Abstract
A method to study energy transfer from a reacted thermite placed on a steel target substrate was presented as a function of thermite composition. A high speed infrared camera captured a temporally evolving thermal distribution through the substrate, while the thermite, which was placed in a v-notch, self propagated. Two thermite compositions were studied: Boron with Iron (III) Oxide (B-Fe2O3) and Aluminum with Iron (III) Oxide (Al-Fe2O3). A numerical model was developed to predict temperatures near the v-notch in order to estimate the amount of energy transferred into the steel by using a control volume energy balance. Results quantified the percent of the overall energy available from the chemical reaction that was conducted through the substrate and was compared to energy lost. The B-Fe2O3 reaction was more efficient in transferring energy into the steel, 46% of its heat of reaction, than Al-Fe2O3, 10% of its heat of reaction, based largely on the lower contribution of losses by radiation and convection. The Al-Fe2O3 reaction produced more gas by chemistry, 10% by mass, which transported more energy away from the v-notch region as compared to the non gas producing B-Fe2O3. The reaction times for the Al-Fe2O3 propagation rate were roughly two to three times faster than the B-Fe2O3 which lowered the heating rate of the substrate. Much work had been performed that examined the combustion behaviors from a reacting thermite, but there are very few studies that attempt to quantify the energy transfer from a reacting thermite to a target. This diagnostic approach and numerical analysis was the first step towards quantifying energy transferred from a thermite into a target and lost to the environment.
 
Last edited:
Metamars : does anybody seriously see 50 or 20 nm Al here ?

[qimg]http://www.bastison.net/Graphique/Images7/Chips_Jones.jpg[/qimg]

(from Harrit and al.)

I see platelets 68 nm thick - with a lot of help from Paint Shop Pro. :)
In the image below, I put a black rectangle around a platelet which is close to on edge, rotated that selection, and lined it up with the 1 micron scale. I put yellow lines to demarcate the edges that I measured. I get 5 pixels / 73 pixels, or .068. That means 68 nm.

1617649f5cc2821289.png


Of course, I should have done this before I started blabbering about 20 nm Al, even though in the specimen in question we are talking about platelet morphology instead of spherical morphology, Al/Fe2O3 instead of Al/MoO3, and DSC in air instead of in Argon.


and Figure 5.8 shows that endothermic peak is more important for 40 nm than 50 nm...

Yes, you're correct, though in light of the last sentence that I wrote, it likely doesn't matter, or, if it does, and behavior is similar to Granier's Fig. 5.8, it's to make the Harrit samples less likely to show a noticeable endotherm at 660C. Correct?

Do tell us, won't you, what your best guess is for Al/MoO3 thermite DSC test in air, for the usual spherical Al particles? Would we see an endotherm in that case, or not? Did you look at the plot of DSC of Al particles in O2, that I show in post 144?
 
The DSC experiment is worthless and there is absolutely no point in spending any time discussing it. It's a red herring. People can theorise and google for papers all they want, but it does not aid the discussion one bit because it's a distraction comparing chalk and cheese just because they both start "ch". Here are the reasons why.

1. No "elemental" aluminium (free aluminium) was found in the samples (a,b,c,d) that underwent the DSC test.

2. None of the particles in the samples a,b,c,d are below 100nm. As Moorea34 points out above.

3. None of the particles found in samples a,b,c,d are spherical.

4. The DSC experiment was performed in air.

All of those nano-thermites contain spherical particles far, far smaller than anything we see in the actual samples. Comparing Al + MoO to the material we have here is like comparing Mt Everest to an Elephant because they are both big. All that is happening is you are being distracted from the actual paper and the data that is in it.

Some people seem to be confusing microns (µm) with nanometres (nm).

1mm = 1000µm.
1µm = 1000nm.
0.1µm = 100nm.
0.05µm = 50nm.

Incidentally most DSCs seem to have an upper limit well below 1000°C.

For example, structural steel is mostly iron, yet the melting point of steel can vary significantly depending on the type. In the "Structural steel" entry of Wikipedia there's a section called Thermal properties which explains how the melting point can vary from 1130°C to about 1539°C, depending apparently on the amount of carbon, if I interpret it correctly.

Isn't it the case, maybe, that some hint on the melting point of these spheres should be provided before taking the step of considering it anomalous?
The problem is that materials on such as small scale do not share the same material properties as the bulk material (great big lump). So when people quote iron or steel melting they are quoting the bulk material property. This cannot be applied to the same material on a far, far smaller scale. Surface area (amongst others) becomes a more important factor at those sizes, such as the Fe2O3 rhomboidal crystals, which look to have a minimum size of approximately 0.1µm.

There has been research with regard to "melting point depression" for some years and we are seeing a drop when sizes are approximately 100nm across although it depends on the material.
 
a very interesting paper about thermite :

Thanks for digging this up. Yes, it does look interesting. I haven't studied it carefully, but I do see that Table 8, p. 51 (p. 62, total) shows Average Particle Size of 202 nm for Al, but < 5 µm for B. The question this raises in my mind is "Would not comparing 202 nm and 5 µm Al powders have shown a similar relationship?" We already know that peak exotherms are at very different temperatures from Al nanopowders compared to Al micron powders. Would not doubling the temperature at which most of the chemical reactions take place lead to much more energy going into adjacent steel? (Which raises the question of why you would want a nanopowder to begin with, of course. But this would ignore the constraint, in a slow CD scenario, of not melting off fireproofing. See below.)

Also, the author says that the main difference in energy loss is the Al nanopowder loses more energy through convection. However, in a "slow CD" scenario where you are merely weakening the steel, so that it fails gradually, one can envision putting a thin layer of nanothermite over a column segment (say 4 mm thick) and covering that over with fire proofing. Would the 13.5% energy loss to gas production (Table 6) be sufficient to make the gasses blow off the fireproofing? If not, would the remainder of the energy production not be so great that it quickly melted or burned the fireproofing? (I don't know the answer to these questions, but IMO these are the sorts of questions that need to be asked when considered a 'slow CD' scenario.) What temperature did WTC fireproofing melt at, anyway?

Speaking of a 'slow CD' scenario, I'm embarrassed to say that I hadn't thought through what may be the biggest problem for this, ito the Harrit chips. They may not burn hot enough! Well, maybe they do if you apply it unevenly (as I have previously suggested), and there are effects arising from the asymmetry of heating and expansion that would actually make a column more vulnerable, as compared to heating it more uniformly, to a temperature 170 C higher.
 
1. No "elemental" aluminium (free aluminium) was found in the samples (a,b,c,d) that underwent the DSC test.
Unlike you, I am reserving judgement on this.

2. None of the particles in the samples a,b,c,d are below 100nm. As Moorea34 points out above.
.068 * 1000 nm = 68 nm. I find the platelets to be 68 nm thick, give or take. How thick do you determine the platelets to be?
 
Metamars, if you want to compare the curves, it would be interesant to compare also the Al particule !

Platelets - Spheres ... Spheres - Platelets

That seems quite different to me....

I've read a lot of papers about nano-Al (15-20) but never platelets... May be have you some references ?
 
Last edited:
Metamars, if you want to compare the curves, it would be interesant to compare also the Al particule !

Platelets - Spheres ... Spheres - Platelets

That seems quite different to me....

I've read a lot of papers about nano-Al (15-20) but never platelets... May be have you some references ?

No, though I've posted references for nano-sized silicon platelets, and regarding the ability to sputter Al onto Si. I tend to think that, by now, if anybody had any public information on somebody creating Al/Si nano- particles, it would be known to us.

As for mass producing such puppies, I'm no chemical engineer, but I don't see why you can't make a tube out of tungsten, hang it vertically, fill it will Al vapor, tumble Si nano-particles (perhaps suitably chilled) into the top, and catch them at the bottom. I have no idea how quickly the Al would condense onto the chips, but I'll bet 50 virtual cents that some smart chemical engineers or material scientists could swing this.

You still haven't commented on whether or not you expect that Harrit's particles, if they are aluminothermics, would show a 660 C endotherm in air or not, in light of the DSC of Al + O2 that I have posted.
 
You still haven't commented on whether or not you expect that Harrit's particles, if they are aluminothermics, would show a 660 C endotherm in air or not, in light of the DSC of Al + O2 that I have posted.

So it's Al or Al-Si ??

Kinetic evaluation of combustion synthesis 3TiO2 + 7Al→3TiAl +
2Al2O3 using non-isothermal DSC method
Peaks endo

Thermite reactions of Al/Cu core-shell nanocomposites with WO3 Peaks endo

COMBUSTION CHARACTERISTICS OF A1
NANOPARTICLES AND NANOCOMPOSITE
A1+MoO3 THERMITES

Peaks endo

Of course all with argon, so for Jones and al. it's a double mistake !!!
Very unlucky !


For the O2 atmosphere, we have again the peaks endo for other size (fig E2a... E2g micrometer size) (Granier)
 

Attachments

  • Nouvelle image.jpg
    Nouvelle image.jpg
    37.9 KB · Views: 8
Last edited:
So it's Al or Al-Si ??
According to Harrit, et. al, it's elemental Al plus Silicon (not an Al/Si compound)

Kinetic evaluation of combustion synthesis 3TiO2 + 7Al→3TiAl +
2Al2O3 using non-isothermal DSC method
Peaks endo

Thermite reactions of Al/Cu core-shell nanocomposites with WO3 Peaks endo

COMBUSTION CHARACTERISTICS OF A1
NANOPARTICLES AND NANOCOMPOSITE
A1+MoO3 THERMITES

Peaks endo

Of course all with argon, so for Jones and al. it's a double mistake !!!
Very unlucky !

Would you be clearer, please? Links, pages, explanations, arguments, etc....

For the O2 atmosphere, we have again the peaks endo for other size (fig E2a... E2g micrometer size) (Granier)

And here even for 40, 80 and 120 nanometers...

View attachment 13737


Where did you get this graph from? Granier? What page? What percentage of O2 is it?

Are you claiming that Harrit, et. al. cannot, under any circumstance have had an aluminothermic, based on lack of 660 endotherm, or are you willing to admit that that is not a solid argument against Harrit, et. al., having nanothermite.

If the latter is the case, are you going to admit so much on your web page?
 
Unlike you, I am reserving judgement on this.
OK peeps lets do some science. Lets first start by reading the paper and doing some analysis on the results specifically with regard to the aluminium.

The first thing is to look at Fig 10 because this Fig is an XEDS map of the various elements across an area of the sample. What this does is helps to visualise where the different elements are and whether there is any connection between them. Humans are good at spotting patterns and the best way is to slowly move your head back from the screen as you look at the graphic. Remember we are interested in Al so concentrate on the purple square. Now you are back a few feet look at the other squares and compare the intensity to the purple square. Notice anything?

picture.php


You did didn't you? What you noticed was that the turquoise and purple squares correlate extremely well. Especially noticeable is the diagonal / in the centre. This means that whatever the turquoise square represents, in this case Silicon (Si), it is strongly connected with Aluminium. In the materials scientists head cogs are starting to turn, because this information pushes us into a certain direction.

So lets now compare the Al and Si maps with the other elements. Fe doesn't show any correlation, infact if anything it's the opposite. We are now thinking that whatever contains the Al and Si doesn't contain much Fe. Onto the O. Again we see correlation with the diagonal and some other points (including the dark vertical area to the left of the diagonal), but we don't see such a striking correlation as with Si and Al, however the correlation is there. Oxygen is found in lots of different compounds and will therefore be associated with parts where Al and Si aren't found in the map. What's important is that there is correlation. Finally Carbon (red square) doesn't match with Al or Si, it doesn't look like it tallies much with Fe, but there is correlation with O. This is quite expected. So now what do we do?

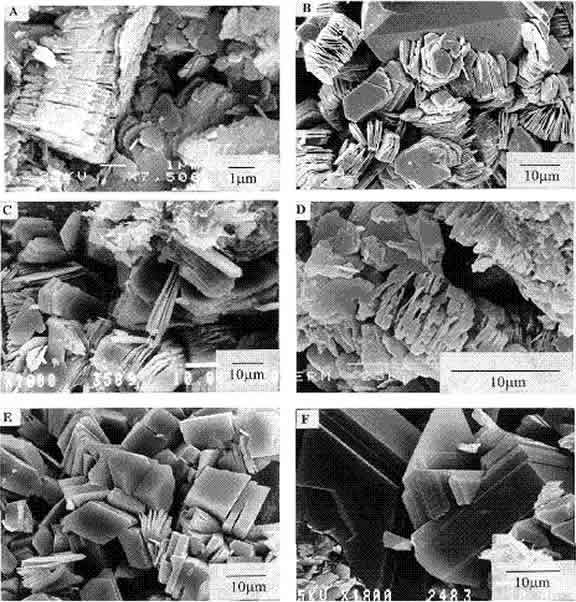
Well you can see the grey BSE image (a) above which is the region where the XEDS map was produced. Look at that image and then look at the Al and Si maps. What do you see? Yep, it's that diagonal again. This means that the Al, Si and O in that diagonal are all associated with that particle. Also not the particle that is just to the right and below the (a). Again that particle has similar associations.

We can also note that the clumps of white particles in that BSE image match that of the Fe map. It's safe to conclude that we have distinctly separate particles, one containing Fe and the other containing Al,Si and O.

So lets take a look at the SEM photo-micrographs.
picture.php


In the middle of photo (a) we can clearly see these particles. Looking at the other photos it becomes self evident that these particles are thin sheet-like particles (platelets) and they have an hexagonal shape to them (d). There is also something else that is interesting about these platelets. Look at the arrow in photo (d). Look at the platelets. What's happened to them? They are all stacked up together. Why is that? What causes that?

So now we have established that the Aluminium and the Silicon as well as some of the Oxygen in the sample (of the red layer) is directly linked to these thin hexagonal platelets.

Has anyone ever had a grow your own crystal toy as a child? You get a tiny seed and place it in a solution and the seed grows and forms a shape. Different solutions give you different shapes. Well the exact same thing happens with platelets like these and also with the whitish grains you can see in the same SEM photos. These whitish crystals are rhomboidal (some say rhombohedral) in shape and because Fe and O are associated with them then we are sure that they are Fe2O3 - experience and reference shows us that this is correct.

Closer magnification as seen in Fig 9 - shows us to be correct.

picture.php


We also notice that there is another material present, namely a Carbon matrix. So now we know that Al cannot be free or elemental, it is bound with Si and O in the crystal. If it wasn't bound in the crystal then we would expect to see another particle that was of a different morphology (structure).

So what are these hexagonal platelets that contain Al, Si and O. These elements point us in the direction of Aluminosilicates, which are minerals or clays, but which one?

Well we could be here for days trying to find the right one. But do you remember the strange stacking? The thin hexagonal platelet. Yep, they are odd aren't they? Kind of stick in the mind as a feature that if you ever came across it again you'd think, "hey, I've seen that!".

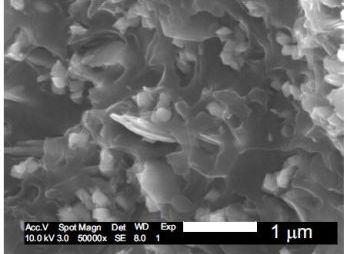
Does this remind you of anything?
Biot226PhotoF.jpg


Or this? (Below are Scanning Electron Microscope Pictures of Kaolinite Interstratified with Illite. Note the platelets of Kaolin are easily observed. )

sem.jpg
http://www.smianalytical.com/clay-analysis.html
and how about this?

Biot226PhotoE.jpg


Remember the XEDS maps and how the Si is associated with Al, remember the identical peak ratios for the platelet

picture.php


Kaolin (Kaolinite) Al2Si2O5(OH)4 will give identical Al and Si peaks, it also has the same shape (as proven above), it also stacks just like the platelets are stacked in Jones' samples. I don't know of any other aluminosilicate material that stacks or has this shape. Does anyone else? Metamars, can you find a material that has these characteristics, but isn't kaolin? Kaolin is a natural mineral. It's morphology is thin platelets. There is no man made engineering going on, just mother nature some physics and chemistry. Wow, how cool is that, material that are nanometres thin are found naturally occurring in minerals.

Kaolin is used in thousands of materials. There is nothing odd or strange about it (except perhaps it's shape and the natural way it's platelets stack - which gave the game away). And there is no elemental aluminium in Kaoulin.

So what happens to the thermite reaction if there is no aluminium free to oxidise? Yep, that's correct, the thermite reaction cannot take place. This proves that the samples are not thermite and did not undergo a thermite reaction in the DSC. Something else reacted and because air was present then combustion most likely took place.

And that folks is how science is done.

Note that no one complains about elemental Oxygen. No one tries to say that the Oxygen isn't part of a compound with the Iron. Yet that is exactly what they do when they talk about the Aluminium. The data in the paper proves Fe2O3 crystals are present and the same data proves that Aluminium is bound up in platelets of Kaolin, so why is no one having a go at elemental O? Why just the Aluminium?

The paper also specifies an MEK test on sample to free this elemental Al, but it isn't any of the samples a,b,c,d that had the full analysis and DSC tests conducted. Infact it's another material altogether.

.068 * 1000 nm = 68 nm. I find the platelets to be 68 nm thick, give or take. How thick do you determine the platelets to be?
Yes, that looks about right. No-one ever measures particle size via their thickness. It's always across the largest diameter.

Imaginary experiment - imagine we take a whole range of diameters of hexagonal platelets, but their thickness doesn't change at 68nm. Now if we pass them through a mesh what is the determining factor for whether they are trapped in the mesh or fall through assuming the mesh hole is round?

That's right it's the platelet's diameter that determines whether it's collected or not. So we characterise materials via their diameter. In any case natural materials produced in mother nature are formed as crystals and do form at very small scales as I have shown.
 
Look at the arrow in photo (d). Look at the platelets.

Correction - it should read (c).
 
I wanted to rebut Henryco's last post and ask him some questions, but he seems uninterested in the discussion so I left out the following from my last post to him in the hope he might answer.

A 5 cm thick steel was reduced do 2.5cm , the rest was of course molten and appears now as swiss cheese (with large holes). 1000°C and an atmosphere rich in SO2 may account for a superficial sulfidation but the magnitude of the effect which is observed is completely out of any reasonable limits and never observed before in similar conditions
What he writes here isn't quite true. I agree that short term sulphidation (as expected if the sulphur was from thermate) alone won't produce the effect but this wasn't short term sulphidation and do not forget that oxidation is also occurring, which in itself is an exothermic reaction. This oxidation will cause a lattice incoherency between parent material (steel) and the oxide layer (rust) resulting in spallation (rust flakes off). Further corrosion will be exacerbated by the grain boundary attack which results in weakening the grain boundaries causing them to separate allowing a deeper and faster penetration of Oxygen. Decarburization is occurring at the surface of the steel as indicated by the lack of cementite (Fe3C) (in pearlite* lamellae) and the overwhelming presence of ferrite (predominantly white part) at the parent material's surface - see below.

picture.php


If thermate where the process used then we wouldn't see the same extent of decarburization as we observe, nor would we see the same level of sulphidation, especially along grain boundaries, because both mechanisms are based on (solid state) diffusion and therefore time dependent. A short time won't produce such an effect but a longer time will. (Just look up carburisation - 100 hours @ 1000°C, [and nitriding] of steels to see time periods required for similar diffusion ). It's for this reason that high temperature corrosion by sulphidation and oxidation is the reason for what is observed. This has occurred over a significant time period. See below - dark area is oxide, light area parent material (steel) - diffusion of species is occurring in the direction from the dark to the light.

picture.php


Previously Molten metal was also found in large quantities sandwitched between layers of concrete in what they have called meteorites: this molten metal is essentially iron (no sulfur).
I know this might be off-topic, but do you have a link to any data for this? The "meteorite" comes up in discussions now and then, but I'm not aware of any analysis and nor is anyone else. This above statement I don't think is true and no one has seen any evidence for this.

The idea that combustion of a 10 micrometer piece of organic material may locally reach the temperature able to melt iron as we see out in the open is completely untenable for obvious reasons (see my previous post). If there is no more serious counter argument on this crucial point, for me the debate is closed. Thanks

Fred
Yes I agree it is untenable. The samples Jones have can't melt steel of any appreciable thickness.

* I expect some of the terms aren't familiar so I'll add some links.

http://www.msm.cam.ac.uk/phase-trans/2008/Steel_Microstructure/SM.html - for general sample preparation for metallography and from the same site
http://www.msm.cam.ac.uk/phase-trans/2008/Steel_Microstructure/SM.html for explanation of steel microstructures.
 
Yes, that looks about right. No-one ever measures particle size via their thickness. It's always across the largest diameter.

I'll have more of a response to the rest of your post, later, but for now:

Using your figure E (or is it R?), I measured 500 nm for the thickness of those platelets. (2 pixels wide / 40 pixels of the scale) * 10,000 nm.

Why don't you show us pictures of kaolinite with thickness around 70 nm?
 

Back
Top Bottom