• Security incident: ISF was recently accessed by intruders. Please change your password, and change it anywhere else you used it. Read more

Global warming discussion IV

Status
Not open for further replies.
Denialists had it right! It's snowing in the Sahara Desert

vq5zlv.jpg


An that in a place where the average low in January is -0.3°C (31°F) and the record low is -10.6°C (13°F). Who wudavthunk this'd be the place that proved AGW is a hoax!
 
Surface temperatures above 80N look sooo bad

http://ocean.dmi.dk/arctic/meant80n.uk.php

Too much for those who proclaim the extra greenhouse effect from extra CO2, methane and the lot does not exist. The typical +7°C during the Winter night is only made of it.

The Arctic sea ice volume by December 1st was more than 2,600 km3 below last year's, so prepare to headlines with sea ice reaching record minimums probably in both poles during the same year. In the Antarctic, the sea ice extent is now almost 2 million square kilometres below the historic mean and more than 3.5 million square kilometres below that of 2014 during solstice. That means an staggering 6 x 10¹⁹ Joules of daily extra heat for the region (15-20 x 1022 is what the whole planet has been forced to absorbed during the last .... 30 years!!!)
 
In the Antarctic, the sea ice extent is now almost 2 million square kilometres below the historic mean and more than 3.5 million square kilometres below that of 2014 during solstice. That means an staggering 6 x 10¹⁹ Joules of daily extra heat for the region (15-20 x 1022 is what the whole planet has been forced to absorbed during the last .... 30 years!!!)

Lucky the oceans are deep ....there IS a limit tho...when the ice stops moderating the climate especially in the north going to be interesting times......already a work in progress.
 
How do you know those riotous freeloader youngsters were Usaians and not Canadian? Did they pronounce /a'baΩt/?

Well, I can't be certain, but the lingering smells of arrogant ignorance and unwarranted entitlement, were compelling indicators.
 
Well, I can't be certain, but the lingering smells of arrogant ignorance and unwarranted entitlement, were compelling indicators.

It didn't smell of wine and cheap perfume, so they weren't from South Detroit.

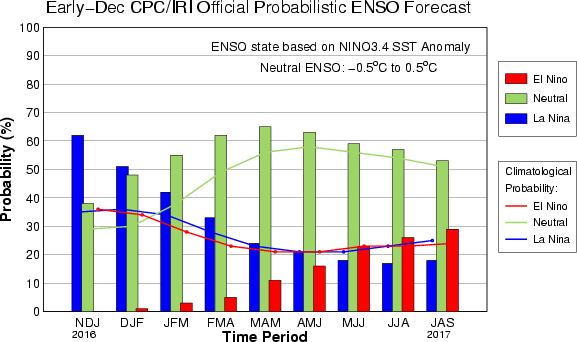
By the way, I've just seen GFDL_FLOR's "ultrasound" and, congratulations, it's a Niño!

As it's customary, it already started with heavy rains and floods in Argentina.
 
It didn't smell of wine and cheap perfume, so they weren't from South Detroit.

By the way, I've just seen GFDL_FLOR's "ultrasound" and, congratulations, it's a Niño!

As it's customary, it already started with heavy rains and floods in Argentina.

Hey, contrary to some stories going around (and with the exception of one Owsley induced episode when I was 16), don't congratulate me, I never had sex with that deity!

All that aside, even a mild Niño is not good news for the currently stressed ecosystems, which could probably benefit from a bit more of a regression toward the mean. I'm simply afraid that we are looking at a somewhat abrupt shift to a new mean.
 
One more denier myth bites the dust....

Study confirms steady warming of oceans for past 75 years
January 4, 2017
Study confirms steady warming of oceans for past 75 years
Ocean buoy (green) and satellite data (orange) measuring sea surface temperatures compared to updated National Oceanic and Atmospheric Administration predictions concluded in 2015 (red) after adjusting for a cold bias in buoy temperature …more
A controversial paper published two years ago that concluded there was no detectable slowdown in ocean warming over the previous 15 years - widely known as the "global warming hiatus" - has now been confirmed using independent data in research led by researchers from the University of California, Berkeley, and Berkeley Earth, a non-profit research institute focused on climate change.
The 2015 analysis showed that the modern buoys now used to measure ocean temperatures tend to report slightly cooler temperatures than older ship-based systems, even when measuring the same part of the ocean at the same time. As buoy measurements have replaced ship measurements, this had hidden some of the real-world warming.
After correcting for this "cold bias," researchers with the National Oceanic and Atmospheric Administration concluded in the journal Science that the oceans have actually warmed 0.12 degrees Celsius (0.22 degrees Fahrenheit) per decade since 2000, nearly twice as fast as earlier estimates of 0.07 degrees Celsius per decade. This brought the rate of ocean temperature rise in line with estimates for the previous 30 years, between 1970 and 1999.
This eliminated much of the global warming hiatus, an apparent slowdown in rising surface temperatures between 1998 and 2012. Many scientists, including the International Panel on Climate Change, acknowledged the puzzling hiatus, while those dubious about global warming pointed to it as evidence that climate change is a hoax.
Climate change skeptics attacked the NOAA researchers and a House of Representatives committee subpoenaed the scientists' emails. NOAA agreed to provide data and respond to any scientific questions but refused to comply with the subpoena, a decision supported by scientists who feared the "chilling effect" of political inquisitions.
The new study, which uses independent data from satellites and robotic floats as well as buoys, concludes that the NOAA results were correct. The paper will be published Jan. 4 in the online, open-access journal Science Advances.
"Our results mean that essentially NOAA got it right, that they were not cooking the books," said lead author Zeke Hausfather, a graduate student in UC Berkeley's Energy and Resources Group.
Study confirms steady warming of oceans for past 75 years
Ocean buoy (green) and satellite data (orange) measuring sea surface temperatures compared to updated National Oceanic and Atmospheric Administration (NOAA) predictions concluded in 2015 (red) after adjusting for a cold bias in buoy …more

586cc89e2f62f.jpg

Ocean buoy (green) and satellite data (orange) measuring sea surface temperatures compared to updated National Oceanic and Atmospheric Administration predictions concluded in 2015 (red) after adjusting for a cold bias in buoy temperature measurements. The Hadley data (purple) has not been adjusted to account for some sources of cold bias. Credit: Zeke Hausfather graphic, UC Berkeley

Read more at: http://phys.org/news/2017-01-steady-oceans-years.html#jCp

 
JMA released their value for last year's anomaly of global average surface temperature and it's confirmed: third back to back record hot year.

2014 ----> +0.27°C over 1981-2010 average (+0.63°C over the 20th century average)
2015 ----> +0.42°C (+0.78°C)
2016 ----> +0.46°C (+0.82°C)

It's very unlikely for 2017 to fit to this regrettable trend, but it's still likely to become 3rd, 4th or 5th hottest year on record.
 
JMA released their value for last year's anomaly of global average surface temperature and it's confirmed: third back to back record hot year.

If that doesn’t extend to 4 you can bet the usual suspect blog sites will call it “recovery”.
 
If that doesn’t extend to 4 you can bet the usual suspect blog sites will call it “recovery”.

Well, certainly Tisdale is calming everyone down telling Spencer confirmed to him 2016's temperatures were just an insignificant 0.02 °C above those during the worst second of 1997/98 El Niño :D:D:D.

To confirm that Watts will soon have a second opinion from Predator's monster informed by Count Dracula.
 
And as our local Starkian* sceptic once explained on an earlier record: The 2016 record is just a measly 0.04°C above the earlier record. That proves nothing Man, because something!

*Winter is coming!

On a more serious note. I understood aleCcowaN as that we are heading into a new el niño. I have two question about that.

1) Any predictions on how strong it will become?
2) Is it normal for a new el niño to form, less than a year after another ended?
 
1) Any predictions on how strong it will become?
2) Is it normal for a new el niño to form, less than a year after another ended?

1) So far, everything points to a short mild El Niño, hardly going beyond +1°C. There is some border noise as they changed the usual way to estimate normals to make the last episode look sharper.
2) It could be like 2002-2007, when we were in and out all the time.

I know we're going into El Niño because "my knee hurts" :D. There are local signs of "El Niño inception" that are unmistakable, though independent of its final intensity and duration.

Besides, climate models have a consistent prediction for Argentina: global warming is going to made wetter the Centre-East and, mostly, the North-East regions, while the West regions are to become drier, specially the Centre-West region and Northern Patagonia, which had become wetter lately. Well, now we're living the living example of those predictions: wild fires have burnt 3 million acres in those regions to turn drier, including some 100,000 acres of crops, and they're still developing; while parts of the East is flooded, with a couple thousand evacuated from a dozen towns and 10% of the total country crops compromised.
 
1) So far, everything points to a short mild El Niño, hardly going beyond +1°C. There is some border noise as they changed the usual way to estimate normals to make the last episode look sharper.
2) It could be like 2002-2007, when we were in and out all the time.

I know we're going into El Niño because "my knee hurts" :D. There are local signs of "El Niño inception" that are unmistakable, though independent of its final intensity and duration.

Besides, climate models have a consistent prediction for Argentina: global warming is going to made wetter the Centre-East and, mostly, the North-East regions, while the West regions are to become drier, specially the Centre-West region and Northern Patagonia, which had become wetter lately. Well, now we're living the living example of those predictions: wild fires have burnt 3 million acres in those regions to turn drier, including some 100,000 acres of crops, and they're still developing; while parts of the East is flooded, with a couple thousand evacuated from a dozen towns and 10% of the total country crops compromised.

Thanks for the reply. So we are back to normal (as in non-dramatic) variations?
 
Thanks for the reply. So we are back to normal (as in non-dramatic) variations?

We're in "dramatic is the new normal" so to speak. Arctic sea ice is now +2,400 km3 below last year's value so next September is going to be the at least the second lowest minimum volume for that variable. And this is just a sample.

Global temperature records are a matter of the tropical regions, which amount for 40% of the planet's surface and get two thirds of the total solar energy. Now it's time for the rest of the planet to reflect the changes. The Southern Ocean shows signals of resumed heat ditching, so we may be up for a new "pause", meaning the underlying trend of +0.14°C/decade isn't going to change soon but its effects on global temperatures might not show as one record high following another but exactly like 2001-2005: heat stays.

Now each subsystem is up for the news, starting with polar sea ice. It may include one heavy hurricane season in US' East Coast, I hope during the campaign for mid-term elections.
 
Status
Not open for further replies.

ISF - Join now!

Every member here is approved by hand. No bots, no spam, just people who care about evidence and honest debate.

Membership is free!

Create your free account

Back
Top Bottom