I understand and agree. But you may consider that those ways to deal with the subject even in the ARs are highly influenced in style and emphasized content by the way denialists the like of Haig's inspirators dealt with the subject. Also, the ARs are not to state the obvious, to teach the masses nor stoop at denialists level, and denialists really fail at the very obvious in this subject. When you or others stick to the ARs and start some abstract hunting using Google with heavy bias toward the "shiny chunk of text" that appears to be the silver bullet, the cross or the string of garlic, you are perpetuating the same failed approach.
Also, I ignored Milankovitch cycles, first, because nothing really important has happened or is going to happen in the past or future century because of those; second, because its mention in the my quote taken from the website of Willson's employers is at best an oversimplification, if not an error: it fails to say that had been the axial precession half cycle behind we'd experience a very different planet with the same TSI.
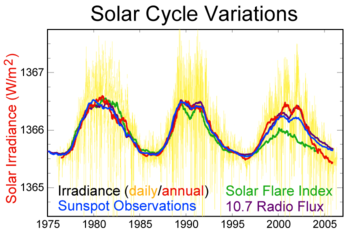
Basically every warmer, denialist and everyone in the middle have to learn how the planet works. A figure showing daily TSI values with all its "variations" produces just a
extremely thin and blurry curve when plotted like
this sea ice extent. You would need a figure of some 5,000 pixels by 5,000 pixels and one-pixel thick curves to perceive it. That is the extent of the negligibility of the solar contribution to our present climate change (and the "up to 10% contribution to GW at most" many here -you, I don't remember- talked in discussions 4 or 5 years ago was a concession of AR3 to the old denialist propaganda, and it's no longer valid for the very same weakening of solar cycles that the new generation of denialists have being selling as a possible harbinger of a new little ice age).
But the fact that you may google and google and not find that plot doesn't mean it is not fundamental knowledge.
Have you ever seen the image of an elliptic orbit in the ARs? It's also fundamental knowledge that the average temperature of the whole planet varies a lot along the year and produces a plot that may be a little bit blurry
but it isn't thin at all. If you choose a shade from blues to reds through purples to represent the monthly values for year 1900 (pure blue) to 2013 (pure red), you find those curves showing warming clearly. You won't easily find this figure either. If you compare both figures "you won't find" you see that the planet warms when TSI falls and the opposite, meaning that there's much more than the Sun as King Star to determine the Earth climate and the negligible variations of TSI@1UA explain only minutia and not the big picture of climate change. TSI@1UA shows that real scientists -not the lame definition around the Oregon petition- have left no stone unturned to explain how it really works and mainly before pointing fingers towards their own species.
 !
! !
! .
.