
r-j
Banned

- Joined
- Nov 30, 2008
- Messages
- 2,689
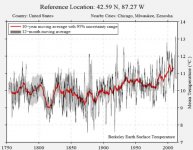
Here is the BEST plot.
http://berkeleyearth.lbl.gov/auto/Local/TAVG/Figures/42.59N-87.27W-TAVG-Trend.pdf

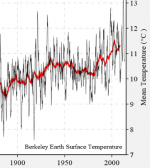
And here is a close up of when we have good records from Chicago.

What is shown there is a fiction. It is completely wrong, it is false, it is the result of computers changing the actual data. And the changes make the past cooler, and the present warmer.
Anyone who studies the history of Chicago will know this with no doubt.
The irony is that they used Chicago as the example of why they had to do the changes.
Very very ironic.
http://berkeleyearth.lbl.gov/auto/Local/TAVG/Figures/42.59N-87.27W-TAVG-Trend.pdf
And here is a close up of when we have good records from Chicago.
What is shown there is a fiction. It is completely wrong, it is false, it is the result of computers changing the actual data. And the changes make the past cooler, and the present warmer.
Anyone who studies the history of Chicago will know this with no doubt.
The irony is that they used Chicago as the example of why they had to do the changes.
Very very ironic.
Attachments
Last edited:

 .
 of recorded temps over 113F. Provide a citation and the whole argument evaporates away. Zeke Hausfather and Robert Rohde are vindicated. Pages and pages of bitter arguments become mute.