• Security incident: ISF was recently accessed by intruders. Please change your password, and change it anywhere else you used it. Read more

Ed The latest on climate science/Climate Conspiracy Theories

For the casual reader...r-j's last posts are factually incorrect. He has provided zero support for any one of his claims and others have pointed this out.

•••
On the contrary - the reality is which is accepted and supported by the world's climate scientists in their papers.

Jan12014piechart.png


There are 56 lines of enquiry leading to this summary... the Holocene Optimum occurred after we exited the last glacial period and was driven by our orbital position and tilt.
http://en.wikipedia.org/wiki/Milankovitch_cycles

29084301.jpg


We have raised the C02 levels of the atmosphere by 40% - levels not seen for millions of years.

How do we know that recent CO2 increases are due to human activities?
Filed under: Climate Science FAQ Greenhouse gases Paleoclimate — eric @ 22 December 2004 - (Svenska) (Español) (Français)

- See more at: http://www.realclimate.org/index.ph...uman-activities-updated/#sthash.Qms6WrZm.dpuf

The global temperature has continued to warm....past the uptick shown on the first graph.

heat_content2000m.png


This is a result of man using fossil fuels and releasing long sequestered carbon to the atmosphere which changes the radiative balance.

If you accept..
CO2 traps IR.

Then you must follow the chain of evidence to where it leads.

It's getting warmer.
We're responsible.


Best place to start to learn the science underlying the change
http://www.realclimate.org/index.php/archives/2007/05/start-here/

others.

http://www.skepticalscience.com/empirical-evidence-for-global-warming.htm

http://ossfoundation.us/projects/environment/global-warming/human-caused

This is a reasonably complete visual of the forces at work including some like aerosols that temporarily offset warming by reflecting incoming radiation back into space.

onlinefig1_high.gif


The red arrows are the crux of the problem.
More IR trapping by CO2.

Follow the chain of evidence that show the mechanism and the evidence for the increase in global energy.

54AB933A-627B-489E-BBE319BE9FEDAC8C.jpg


735DEC0E-749C-4EFF-A3EDDCA469488883.jpg


20121230_Icesheet_mass_balance_2009_fig2.gif


The explanation and physics are rather simple - the evidence of the changes towards a warmer climate regime are massive.

The rest of the r-j's claim is simply conspiracy nonsense with no basis in fact whatsoever nor does he provide any supporting documents. You may draw your own conclusions about that and as a result how valid his "opinion" is regarding AGW.

It's okay to be wrong....it's not okay to persist in making factually incorrect statements in a science forum.:rolleyes:
 
Last edited:
Actually there is, but you won't know this from the alarmist press. The constant message is drastic warming (dangerous warming), even when the observed warming is actually cooling.
...some "alarmist" ranting snipped...
Please cite the evidence that the "observed warming is actually cooling", r-j.

Any records that show no warming, or even worse, cooling, are "adjusted" to be in line with the story that it's all warming, all the time.
Please cite your evidence for this scientific fraud of adjusting data to fit preconceived ideas, r-j :eek:.

The raw data actually shows cooling for most of the world.
That looks like a ridiculous claim, r-j. We are talking about global temperatures which are for all of the world not "most of the world". My guess it that you are derailing into NH winters getting cooler yet again :p.
But:
Please state exactly what "cooling for most of the world" means, r-j.
And if it is relevant to the topic (global temperatures):
Please cite your evidence od raw data that shows cooling of global temperatures, r-j.


They claim CO2 forcing is causing the current warming, when there isn't any warming.
Wow - that is really ignorant, r-j.
Climate scientists (97% of them!) claim that there has been global warming over the last century when the data shows that there has been global warming over the last century :jaw-dropp!

It is idiotic to claim that the hiatus in warming over the last decade or so means that global warming has stopped or never existed. It is possible for climate science to explain the hiatus. Climate models can explain the hiatus:
The Pacific Ocean fills in another piece of the global warming puzzle, and puzzles Curry
Recent global-warming hiatus tied to equatorial Pacific surface cooling
Despite the continued increase in atmospheric greenhouse gas concentrations, the annual-mean global temperature has not risen in the twenty-first century1, 2, challenging the prevailing view that anthropogenic forcing causes climate warming. Various mechanisms have been proposed for this hiatus in global warming3, 4, 5, 6, but their relative importance has not been quantified, hampering observational estimates of climate sensitivity. Here we show that accounting for recent cooling in the eastern equatorial Pacific reconciles climate simulations and observations. ...

Ignorance of climate science does not mean that any goalposts have been moved, r-j!
Climate science has always said that most of the "warming" of the Earth happens inside the oceans, i.e. they are more of a heat reservoir than the land. Surface temperatures are really a proxy for the total (surface + ocean) warming. The worrying thing is that hiatus in surface temperature increases + the continued increase in ocean heat content hints at a reversal of the hiatus to a steep increase in surface temperatures. Sooner or later the conditions causing the hiatus will (hopefully) vanish or (pessimistically) reverse.

Here is the science listed in Skeptical Science articles for you to ignore one more time r-j!
* Global warming not slowing - it's speeding up
* Unprecedented trade wind strength is shifting global warming to the oceans, but for how much longer?
* Warming oceans consistent with rising sea level & global energy imbalance
* Global warming is unpaused and stuck on fast forward, new research shows
* Does the global warming 'pause' mean what you think it means?
* Global Warming’s Missing Heat: Look Back In Anger (and considerable disbelief)…
About a 1979 report that essentially predicted what is going on today :cool:.
However, the study group points out that the ocean, the great and ponderous flywheel of the global climate system, may be expected to slow the course of observable climatic change. A wait-and-see policy may mean waiting until it is too late
* The Pacific Ocean fills in another piece of the global warming puzzle, and puzzles Curry
 
Winnipeg Canada has the coldest winter in 116 years
http://www.winnipegfreepress.com/local/citys-worst-winter-since-98----1898-254004961.html

Brisbane Australia has its coldest temperature in 103 years
http://www.theaustralian.com.au/new...986116278?nk=9fe3cbf4f5bf37a6dc3f771dfd4654b8

Coldest Antarctica in June ever recorded
http://wattsupwiththat.com/2014/07/12/coldest-antarctic-june-ever-recorded/

Al Gore says Global warming is the biggest crisis our civilization faces
http://www.bbc.com/news/magazine-28199131
 
Winnipeg Canada has the coldest winter in 116 years
http://www.winnipegfreepress.com/local/citys-worst-winter-since-98----1898-254004961.html

Brisbane Australia has its coldest temperature in 103 years
http://www.theaustralian.com.au/new...986116278?nk=9fe3cbf4f5bf37a6dc3f771dfd4654b8

Coldest Antarctica in June ever recorded
http://wattsupwiththat.com/2014/07/12/coldest-antarctic-june-ever-recorded/

Al Gore says Global warming is the biggest crisis our civilization faces
http://www.bbc.com/news/magazine-28199131

Uh huh.

Australia has experienced its hottest two years on record and high temperatures are set to continue through winter in a clear sign of climate change, a report warns.


May 2012 to April 2014 was the hottest 24-month period ever recorded in Australia, but that is likely to be eclipsed by the two years between June 2012 and May 2014, according to the Climate Commission's latest report, Abnormal Autumn.

http://www.theguardian.com/environm...a-experiences-its-hottest-two-years-on-record


.... from the article ...... The average temperature across Australia in April was 1.11C above the long-term average, the report says, citing Bureau of Meteorology figures


1.11 C does not sound like a lot to me , at least not enough to use phrases like ... "very hot angry summer" ....

A prolonged stretch of abnormally cold temperatures could very well bring the average temperatures back to normal

We have to keep in mind that global temperatures have only increased by 0.8C over the past 100 years so its not like we have a roaring bonfire to put out.

I cannot deny that I am one of those weird guys who is happy when the planet does not get as hot as predicted.
 
.... from the article ...... The average temperature across Australia in April was 1.11C above the long-term average, the report says, citing Bureau of Meteorology figures


1.11 C does not sound like a lot to me , at least not enough to use phrases like ... "very hot angry summer" ....

A prolonged stretch of abnormally cold temperatures could very well bring the average temperatures back to normal

We have to keep in mind that global temperatures have only increased by 0.8C over the past 100 years so its not like we have a roaring bonfire to put out.

I cannot deny that I am one of those weird guys who is happy when the planet does not get as hot as predicted.

0.8 or 1.1 degrees doesn´t sound much, but IIRC the temperature difference between now and the last ice age is only something like 5 degrees.
 
0.8 or 1.1 degrees doesn´t sound much, but IIRC the temperature difference between now and the last ice age is only something like 5 degrees.
Or more realistically, 0.8 or 1.1 degrees is the difference between now and the little ice age. The actual real climate period that the world has been slowly warming up from.
 
...I cannot deny that I am one of those weird guys who is happy when the planet does not get as hot as predicted.

You must have been leading an extremely unhappy life for the last ~30 years or so, with an accelerating and growing unhappiness over that entire period and into the future! How horrible!

http://www.ncdc.noaa.gov/sotc/
•The combined average temperature over global land and ocean surfaces for May 2014 was the record highest for the month, at 59.93°F (15.54°C) or 1.33°F (0.74°C) above the 20th century average. The margin of error associated with this temperature is ±0.13°F (0.07°C).

•May marked the 39th consecutive May and 351st consecutive month with a global temperature above the 20th century average. The last below-average temperature for May occurred in 1976 and the last below-average temperature for any month occurred in February 1985.

http://www.wmo.int/pages/themes/climate/climate_projections.php

Global Temperature
The basic projection is that the global surface air temperature is going to increase with all scenarios. Even if the concentrations of all greenhouse gases and aerosols were kept constant at year 2000 levels, a further warming of about 0.1°C per decade would be expected. If emissions are kept within the range of the IPCC scenarios about twice as much warming (0.2°C per decade) can be expected.

Perhaps some anti-depressants would help!
 
The last below-average temperature for May occurred in 1976 and the last below-average temperature for any month occurred in February 1985.

Perhaps some anti-depressants would help!

I suppose I could use some, too. Every time I read that I get a little more depressed. The last month with an average temperature below the 20th century average was seven months before I was born. I have never seen a month below average. :(
 
Or more realistically, 0.8 or 1.1 degrees is the difference between now and the little ice age. The actual real climate period that the world has been slowly warming up from.

not at all. do you have any scientific study backing your claim?

and why did we warm up from the LIA? what caused it ?

and why do you not answer my last post to you? :D
 
I suppose I could use some, too. Every time I read that I get a little more depressed. The last month with an average temperature below the 20th century average was seven months before I was born. I have never seen a month below average. :(

I can fully relate, having been around long enough to have witnessed several long episodes of below average months only gives me more of a comparison for the last 30 years.
 
The last month with an average temperature below the 20th century average was seven months before I was born. I have never seen a month below average. :(
Get over it.

Nobody in the entire 20th century every saw a month below the 19th century average. And nobody in the 18th century ever saw a month below the 17th century average. And they lived and died with out ever knowing it. And they were just fine.
 
Get over it.

Nobody in the entire 20th century every saw a month below the 19th century average. And nobody in the 18th century ever saw a month below the 17th century average. And they lived and died with out ever knowing it. And they were just fine.

And then there's reality,...think, what is the second most important feature making the "Hockey Stick" look like a hockey stick?

The long slightly downward angled handle extending from the first millennium to the late 1800s. The "blade" did not turn upward until around 1880.
 
Get over it.

Nobody in the entire 20th century every saw a month below the 19th century average. And nobody in the 18th century ever saw a month below the 17th century average. And they lived and died with out ever knowing it. And they were just fine.


And then there's reality,...think, what is the second most important feature making the "Hockey Stick" look like a hockey stick?

The long slightly downward angled handle extending from the first millennium to the late 1800s. The "blade" did not turn upward until around 1880.
 
,

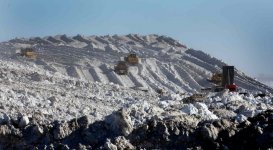
Coldest winter in 116 years and on August 8th 2014 the Winnipeg snow pile is still 60 feet high

It has sand on it from clearing the streets , thus the color , included is a mid winter picture when pile is being constructed

,
 

Attachments

  • dumping snow from winnipeg streets  winter 2013-14.jpg
    dumping snow from winnipeg streets winter 2013-14.jpg
    89.5 KB · Views: 4
  • august 8 2014 remaining winnipeg snow pile.jpg
    august 8 2014 remaining winnipeg snow pile.jpg
    123.5 KB · Views: 4
,

Coldest winter in 116 years and on August 8th 2014 the Winnipeg snow pile is still 60 feet high

It has sand on it from clearing the streets , thus the color , included is a mid winter picture when pile is being constructed

,
There's an aspect of global warming that a lot of people don't seem to grasp. It's the...
global
... aspect.
 

ISF - Join now!

Every member here is approved by hand. No bots, no spam, just people who care about evidence and honest debate.

Membership is free!

Create your free account

Back
Top Bottom