• Quick note - the problem with Youtube videos not embedding on the forum appears to have been fixed, thanks to ZiprHead. If you do still see problems let me know.

NIST blew WTC7 Stage 1 analysis

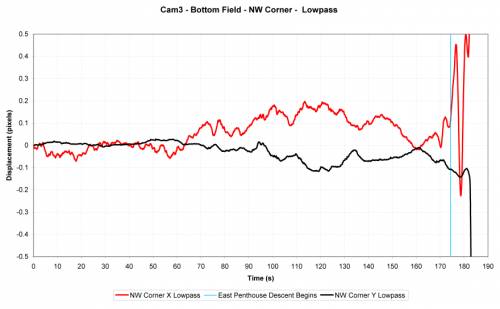
How could any horizontal motion have occurred independently of, or prior to, vertical motion? What powered the horizontal motion, if not descent (i.e. vertical motion) of the center of gravity of the moving mass? Was someone pulling on a cable somewhere?

Respectfully,
Myriad

There could be some horizontal movement from the pull of the beams / girders on the exterior walls while the interior collapsed under the East Penthouse. This is why the one wall would kink, as the moment frame collapsed inward under the strain.
 
Last edited:
Could the usual suspects please refrain from harrassing and tearing appart uglypig's and achimspok's (and perhaps M_T's) arguments on topics which the OP wishes to debate before these arguments have even been presented? Thanks.
 
666377698.jpg


fig_5_20.jpg


Only two pics, folks. Some very large local collapse followed by 2 minutes of global deformation. That's why NIST's model doesn't reach freefall. The global collapse took two whole minutes. So it doesn't surprise me that it entered freefall.
 
Could the usual suspects please refrain from harrassing and tearing appart uglypig's and achimspok's (and perhaps M_T's) arguments on topics which the OP wishes to debate before these arguments have even been presented? Thanks.

Still waiting for the arguments whilst the nanny buzzes about trying to distract from their absence on this new thread. :)

Still waiting for any of this band of geniuses (or genii) to present their presently self-acclaimed discoveries to any major scientific conference anywhere on this planet.

Still waiting for the publication of any of this material in a relevant peer-reviewed journal.

How long has it been already? Time is ticking, as they say, yet they're a no-show.
 
[qimg]http://femr2.ucoz.com/_ph/7/2/666377698.jpg[/qimg]

[qimg]http://i711.photobucket.com/albums/ww114/peterene/fig_5_20.jpg[/qimg]

Only two pics, folks. Some very large local collapse followed by 2 minutes of global deformation. That's why NIST's model doesn't reach freefall. The global collapse took two whole minutes. So it doesn't surprise me that it entered freefall.

Thank you. Can you provide links to higher-resolution graphics please, these are too small to read. When I zoomed in it was too pixelated to read.

Also we need to have your full analysis of your graph, including your methods and your conclusions. Otherwise it's pretty ambiguous.
 
Hey uglypig,
I see a lot a familar names pooped already loads without saying anything, measuring anything, concluding always the same since years and years and year... no progress whatsoever.

Let's forget about all that time wasting babble.

I did a quick measuring of the lateral component of the motion of WTC7 top in the well known NIST camera3 (CBS Net Dub7 47). That video starts about 3 minutes prior to the total core-pull-building-down-collapse.

jzvg2u.jpg


I neither can find a major event during that time nor any increasing leaning to the east or west. At the end of the red graph you see the NW-corner of the E-Penthous falling towards east.
There is some kind of event (or failure) near frame 3300 that only affected the east penthouse but not the NW corner of the building.
...but there is some other interesting effect starting about at frame 4900. Its within the timeframe NIST used to measure the building sway by subtraction method. Imo the building appears to twist a little bit because both graphs getting closer one to another.
I dont konw if there is any use for it but apparently the west side of the building startet to lean a little bit towards north. In the perspective of camera 3 (west street) it would appear like a shortning of the distance between NW corner and penthouse.
 
Take notes. Discussion hardly rises to a technical level in this forum so I take notes on why this is so. Would you like a demonstration?

It rises to the kindergarten level that truthers are stuck on.
 
Hey uglypig,
I see a lot a familar names pooped already loads without saying anything, measuring anything, concluding always the same since years and years and year... no progress whatsoever.

Let's forget about all that time wasting babble.

I did a quick measuring of the lateral component of the motion of WTC7 top in the well known NIST camera3 (CBS Net Dub7 47). That video starts about 3 minutes prior to the total core-pull-building-down-collapse.

[qimg]http://i45.tinypic.com/jzvg2u.jpg[/qimg]

I neither can find a major event during that time nor any increasing leaning to the east or west. At the end of the red graph you see the NW-corner of the E-Penthous falling towards east.
There is some kind of event (or failure) near frame 3300 that only affected the east penthouse but not the NW corner of the building.
...but there is some other interesting effect starting about at frame 4900. Its within the timeframe NIST used to measure the building sway by subtraction method. Imo the building appears to twist a little bit because both graphs getting closer one to another.
I dont konw if there is any use for it but apparently the west side of the building startet to lean a little bit towards north. In the perspective of camera 3 (west street) it would appear like a shortning of the distance between NW corner and penthouse.

This is an interesting graph. Do you have a similar plot from earlier on, say 30 minutes or so, to compare to? I'm wondering how much of the apparent motion is due to artifacts from the equipment vs actual movement.

Also have you done a synopsis of your findings correlating your data and providing some definitions and conclusions of the findings? It would be helpful to those of us who haven't spent hours with the materials.

Thank you
 
Hey uglypig,
I see a lot a familar names pooped ...

How did you filter out lateral movement from camera motion? link is fine
Were the buildings in the foreground swaying? link is fine
How much noise is from the atmosphere? link is fine
What kind of errors did you think about? link is fine

This is an interesting graph. Do you have a similar plot from earlier on, say 30 minutes or so,...Thank you

A piggyback on this...


I have to admit, asking questions on your "technical" work when you can't figure out a passport survived Flight 11, or why physics allows that to happen, seems like a waste of time. Or the Atta worked for the USA... it only gets worse.

But I am interested in the control method for removing camera movement from the sway.
 
Last edited:
There is some kind of event (or failure) near frame 3300 that only affected the east penthouse but not the NW corner of the building.
...but there is some other interesting effect starting about at frame 4900. Its within the timeframe NIST used to measure the building sway by subtraction method. Imo the building appears to twist a little bit because both graphs getting closer one to another.
I dont konw if there is any use for it but apparently the west side of the building startet to lean a little bit towards north. In the perspective of camera 3 (west street) it would appear like a shortning of the distance between NW corner and penthouse.
That event at 3300 clearly rises above the noise, so it is interesting. The other event at 4900 could be the actual collapse initiation since it is so close to the core drop.
 
How did you filter out lateral movement from camera motion? link is fine
Were the buildings in the foreground swaying? link is fine
How much noise is from the atmosphere? link is fine
What kind of errors did you think about? link is fine


A piggyback on this...


I have to admit, asking questions on your "technical" work when you can't figure out a passport survived Flight 11, or why physics allows that to happen, seems like a waste of time. Or the Atta worked for the USA... it only gets worse.

But I am interested in the control method for removing camera movement from the sway.

LOL! You figured out that Passport? Show me where it was found! And please explain the motive behind the Tippex fraud!

You can easily filter out any camera motion by measuring known static elements (such as a window at West St. or even the Verizon Bldg.) and subtract the result from the different spots measured at WTC7.
The noise of these data is pretty visible by the blank eye (no LP filter applied).
Both graphs are taken from different points (NW corner of the building and NW corner of the Penthouse). You clearly see a pretty similar pattern in both graphs after excluding any motion that also affected the appearance of the Verizon.
The scale is just vague. I took the width of the building and devided it by the measured units to get a "units per meter" factor. Of course the meter in the foreground is a little wider than the meter in the background but that difference is pretty small as you see by comparing similar movements of both points (the effect would be a larger amplitude of the blue graph but it's obviously invisible).

Here is a LP version including the vertical components.
20u4ugz.jpg


You may like to compare the NIST measurment (but they had East = up)
image00041.png


You see that NIST had a West-peak of 8 inches (0.2m) prior to the total collapse. I'm afraid that 5 inches (0.126m) is closer to reality because the described method to get a scale without correction of the perspective tends to amplify the closer points.
 
[qimg]http://femr2.ucoz.com/_ph/7/2/666377698.jpg[/qimg]
That's very small movement. Note that the swaying at the end (to the right of the blue line) matches the NIST analysis, which has a range of about 14 inches top-to-bottom. Therefore that early movement, in an eyeball comparison, has a range of about 5 inches.

[qimg]http://i711.photobucket.com/albums/ww114/peterene/fig_5_20.jpg[/qimg]
That strongly looks like lens distortion to me. Note how the right side of the building is aligned with the white building in front of it, while the left side is more or less aligned with the buildings on the left.

Is this the whole photograph or is it a crop of a bigger one?
 
I am talking about the firkin' huge dust cloud you've missed.
How do you know it's dust? NIST calls it smoke. What time was that pic taken at?

Certainly it's possible that that was caused by local collapses. NIST doesn't have enough information to emit an opinion:

Heavy, dark smoke is visible rising along the east side of the building. There is also considerable smoke passing across the north face. The source of this smoke is not immediately obvious.

During the clip from which Figure 5-157 was taken, the camera zoomed in on the same area shown in Figure 5-152. Heavy smoke was visible rising from near the northwest corner. Suddenly, several pulses of jet flames several stories high were pushed out of a window near 13-54B on the 13th floor. These pulses continued for about 6 s. Figure 5-158 shows a frame captured during one of these pulses.

The amount of smoke on the north face increased dramatically at the same time as the pulses. This is the only time that this unusual behavior was observed for WTC 7. Similar behaviors observed during the fires in the WTC towers (NCSTAR-1-5A) were attributed to internal pressure pulses generated by events such as local collapses within the buildings. Since the exact time for this particular event is unknown, it is not possible to associate it with a known event within WTC 7.
(NCSTAR 1-9, p.240 - PDF Vol 1 p.284)

But even if these were local collapses, that doesn't mean that the global collapse was underway. If you want to push the meaning, you can say as well that the global collapse started at 10:29am.
 
Judging by the color, shape... (it's some 50m high and 70m wide).. it has to be dust. The only other real possibility is some very large (fuel oil) fire. Remember, the office fires were unable to project any smoke on the north side of the building. And now, suddenly.....two mins before the global collapse....? No way.

The floor system gave way, even achim confirmed that the east penthouse has shifted. The real collapse had a headstart before the sim, IMHO this is why the NIST sim can't create the freefall drop. Who know, maybe truss no. 2 or 3 was hanging and asking for excuse to collapse even before the EP fell.
 
Can you provide links to higher-resolution graphics please
That's one of mine.

666377698.png


Numerous others in this album.

I'm not aware of uglypig having actually done any feature tracing. I'm sure you're aware of how to re-find my discussion on the topic here. You were, after all, involved in them.

It's likely the early motion is twisting of the building.
 
I've set up this thread for achimspok & uglypig to make their arguments that NIST blew the calculation of the Stage 1 of WTC7 collapse.
You've been through this with me, in detail, many times.

Apparently, achimspok believes that NIST mistook horizontal motion for vertical motion, resulting in an actual Stage 1 descent of much less than 1.75 seconds.
The vague "staging" is somewhat of a red herring, as I'm sure you know.

Here's my acceleration profile data -vs- NISTs. This is a "unshifted" graph (I shifted the NIST curve back 1s in later graphs to account for their incorrect T0)...
513801604.png


The NIST curve above is set to begin at my T0.

From release to maximum acceleration took ~1s for the NW corner.

And uglypig believes that there was approximately 2 minutes of collapse going on prior to "global collapse" that was measurable from some motion of the external wall(s) of the building.
Again, you're fully aware of the early motion data I've already presented.

Slight motion of the NW corner was detectable several minutes prior to release.
 
As a reminder...

The NIST data suffers from the following (non-exhaustive) series of technical issues, each of which reduce the quality, validity and relevance of the data in various measures...

  • NIST did not deinterlace their source video. This has two main detrimental effects: 1) Each image they look at is actually a composite of two separate points in time, and 2) Instant halving of the number of frames available...half the available video data information. Tracing features using interlaced video is a really bad idea, especially for features changing vertical position. I have gone into detail on issues related to tracing of features using interlaced video data previously.
  • NIST did not sample every frame, reducing the sampling rate considerably and reducing available data redundancy for the purposes of noise reduction and derivation of velocity and acceleration profile data.
  • NIST used an inconsistent inter-sample time-step, skipping roughly every 56 out of 60 available unique images. They ignored over 90% of the available positional data.
  • NIST likely used a manual (by hand-eye) tracking process using two single pixel columns, rather than a tried and tested feature tracking method such as those provided in systems such as SynthEyes. Manual tracking introduces a raft of accuracy issues. Feature tracking systems such as SynthEyes employ an automated region-based system which entails upscaling of the target region, application of LancZos3 filtering and pattern matching (with FOM) to provide a sub-pixel accurate relative location of initial feature pattern in subsequent frames in video.
  • NIST tracked the *roofline* using a pixel column, rather than an actual feature of the building. This means that the trace is not actually of a point of the building, as the building does not descend completely vertically. This means the tracked pixel column is actually a rather meaningless point on the roofline which wanders left and right as the building moves East and West.
  • NIST chose an initial trace location which precluded starting the trace before the East Penthouse had already descended (as the East Penthouse obscured their trace location). Consequently they no way of gathering early motion data, or quantifying long term noise levels.
  • NIST chose a trace endpoint which could not be traced from their selected T0 time, and so subsequently merged data from two separate traces together, without accounting for change in scaling metric.
  • NIST used the Cam#3 viewpoint which includes significant perspective effects (such as early motion being north-south rather than up-down and yet appearing to be vertical motion). It also means that each horizontal position across the facade requires calculation of a unique scaling metric, which NIST did not bother to do.
  • NIST did not perform perspective correction upon the resultant trace data.
  • NIST did not recognise that the initial movement at their chosen pixel column was primarily north-south movement resulting from twisting of the building before the release point of the north facade.
  • NIST did not perform static point extraction (H, V). Even when the camera appears static, there is still (at least) fine movement. Subtraction of static point movement from trace data significantly reduces camera shake noise, and so reduces track data noise.
  • NIST did not choose a track point which could actually be identified from the beginning to the end of the trace, and so they needed to splice together information from separate points. Without perspective correction the scaling metrics for these two points resulted in data skewing, especially of the early motion.
  • NIST performed only a linear approximation for acceleration, choosing not to further derive their chosen displacement function.
  • NISTs displacement function, if derived to obtain acceleration/time contains a ~1s period of over-g acceleration. Whilst that in itself is fine, it's at the wrong time, and in their conclusions they ignore it.
  • NISTs displacement function, if derived to obtain acceleration/time does not suggest a 2.25s period of roughly gravitational acceleration.
  • The displacement data appears to have been extracted initially from the T0 pixel column, but using the scaling factor determined for a point above Region B, further skewing the displacement data.
 
As a reminder...

The NIST data suffers from the following (non-exhaustive) series of ...


Thank goodness they did not waste their time with a goal free pursuit of Mr Monk like obsession with smoothing data beyond recognition, or some form of "Demolition-itis". NIST suffer from being goal oriented, not into making fancy curves.

When will this NIST bashing be published, and how does it lead to a new probable (yep, probable) collapse sequence?
 

Back
Top Bottom