Moderated Iron sun with Aether batteries...

Status
Not open for further replies.
That is because the white light photosphere from one of the two channels that is sensitive to that surface was simply 'subtracted" from the HeII image. Since the white light surface is relatively smooth, so is the underside of that HeII image. Since the mass flows tend to flow up and through that point, all the mass flows create the jagged edges that look like flames.


You don't have the slightest idea what you're talking about. That argument is so completely wrong there's not even a way to repair it. Of course your qualifications to understand any sort of solar imagery have been challenged and you haven't been able to show that you have any such qualifications. But for you to keep putting forth these crap arguments that you're making up from scratch is just a ridiculous and dishonest ploy.
 
And once more, is there some particular reason you are completely unwilling to do your own homework? A little graphics processing or some simple math too difficult?

I already did all that. I put my numbers on the table. I "guess" I finally got you do to that today, but I've yet to hear you even bet your public opinion on the outcome. Are you even willing to go that far?
 
Michael Mozina said:
http://aia.lmsal.com/public/firstlig...11_193_171.jpg

Is there anyone here that really cannot find the "opaque" limb of the sun in the iron ion wavelengths in a multiple color/wavelength image?

Does anyone actually believe it cannot be found in *EVERY* iron ion wavelength?
Nobody here is quite clear on what you're talking about. Your use of the standard terminology of solar physics is so badly convoluted that your arguments amount to piles of gibberish.
I'll second GM's comment.

Does anyone know if MM has ever - here in this thread, in other JREF threads, in other fora - provided a detailed, objective, quantitative method by which anyone could (in principle) independently "find the "opaque" limb of the sun in the iron ion wavelengths in a multiple color/wavelength image"? If so, where?

Now MM is well-known for his use of double quotes around key terms (" "opaque" ", for example). The usual meaning of such an orthographic device is something like "the term here is used with a non-standard meaning", and is usually followed (or preceded) by a careful definition of what that non-standard meaning is.

As opaque is rather important to MM's idea, one would expect that he has carefully defined it, preferably in quantitative terms.

Does anyone know if MM has, in fact, done that?
 
You don't have the slightest idea what you're talking about. That argument is so completely wrong there's not even a way to repair it.

If that is all true, then the LMSAL RD technique that created that first gold RD image on my website will show show it conclusively in the SDO images. Go use your inside contacts for something constructive that will actually "settle" our debate. I'm tired of arguing with you and one test is worth a thousand expert opinions. All you have to do is run the 171A channel of SDO through the LMSAL RD technique I cited. Overlay that image and HeII ring from the composite image. That will tell us everything we need to see in a single composite image. If you're correct, then the outlined RD disk will align itself with the underside of the chromosphere. If I am correct, it will come up 4800KM short of that line all along the limb.

If you want to "challenge" me any further on RD images, we need someone other than you and me to settle it based on the 6 steps I outlined. Are you willing to abide by the results of that "test", yes or no?
 
Last edited:
Michael Mozina said:
That is because the white light photosphere from one of the two channels that is sensitive to that surface was simply 'subtracted" from the HeII image. Since the white light surface is relatively smooth, so is the underside of that HeII image. Since the mass flows tend to flow up and through that point, all the mass flows create the jagged edges that look like flames.
You don't have the slightest idea what you're talking about. That argument is so completely wrong there's not even a way to repair it. Of course your qualifications to understand any sort of solar imagery have been challenged and you haven't been able to show that you have any such qualifications. But for you to keep putting forth these crap arguments that you're making up from scratch is just a ridiculous and dishonest ploy.
I can't be sure, but if MM is referring to the SDO First Light Image, GM's comment is spot on.

That image was processed from data received from the AIA, specifically, from three (or four?) EUV channels.

Does anyone know if MM has ever backed up his multi-wavelength (channel) image interpretations with references to the published specifics of the image processing that was done to produce the composites?
 
Is anyone here going to bet their public position on the outcome of the 6 step process that I just outlined, yes or no?
 
It's not actually "absent" if you take the image apart, but I'm not publishing any more solar images EVER. I'm done. You can do it for yourself if you like. The reason it looks to be absent in that one image is because of the high amount of activity in that region that is "in front of" that part of the limb.


Sooooo . . . there's more solar activity in the image on the right than there is in the image on the left? It's sort of . . . invisible activity in the nearly-transparent chromasphere, and it blocks all light that comes through the limb but doesn't block light that skims in just above the limb? Because the limb is still perfectly sharp and smooth, despite all of this activity.

Also, in the image on the left (particularly the top left) - how can the prominences come up through the atmosphere without disturbing the atmosphere? Shouldn't the top of the atmosphere be ruffled rather than smooth?
 

Attachments

  • left side.jpg
    left side.jpg
    26 KB · Views: 1
  • right side.jpg
    right side.jpg
    28 KB · Views: 2
Michael Mozina said:
Follow the following steps GM.

Step 1: Go get the software that produced the high cadence/averaged RD image that is the first image on my website.

Step 2: Run the 171A channel of SDO through that routine.

Step 3. Take a HeII ion SDO image and subtract out the while light photosphere as was done in the composite image.

Step 4 overlay the remaining HeII image on the RD image just as was done with the published composite image.

Step 5: Count the pixels between the disk borders and the inside edge of the chromosphere.

Step 6: Publish the results.

Is that clear enough for you?

If the edge of the gold disk isn't 4800Km inside of the chromosphere, this solar model goes down in flame. If it does show up along those limb darkened areas, 4800 km inside that chrmosophere, then the SSM is falsified and you'll need electricity to fix it. What a hell of a dilemma for you guys. You *HATE* EU theory with a passion, but the only way to fix *any* plasma solar theory is going to require that you add electrical current to your theory. Wow. That's going to be quite the ego fry for you.
And once more, is there some particular reason you are completely unwilling to do your own homework? A little graphics processing or some simple math too difficult?
OMG, is this what MM thinks constitutes a valid test?!?!? :jaw-dropp

Am I the only one who has no idea what MM means, in nearly every step here?

For example:
* "Run the 171A channel of SDO through that routine" - what is "the 171A channel of SDO"?!?

* "Take a HeII ion SDO image" - what, any one of my choosing? One taken three months later perhaps?

* "subtract out the while light photosphere" - and how, exactly, does one do that?!?

* "as was done in the composite image" - which "composite image"? Where is the reference to how it "was done in the composite image" in the first place?

* "the inside edge of the chromosphere" - and one determines this ... how, exactly?!?

(where's the ROTFL icon?)
 
Sooooo . . . there's more solar activity in the image on the right than there is in the image on the left?

There is more coronal loop activity on the right than on the left, at least along the limb lines.

It's sort of . . . invisible activity in the nearly-transparent chromasphere, and it blocks all light that comes through the limb but doesn't block light that skims in just above the limb? Because the limb is still perfectly sharp and smooth, despite all of this activity.

The light from the limb is simply "drowned out" by the light in the forefront part of the image. If we happened to run that same image say a week later, it would be easy to spot the same limb darkening feature. It's only because there is so much activity and light from in front of that limb that it makes it so difficult to observe. If however you look at my blog, I selected three different points around the clock that all show the same 4800Km gap between the bottom of the chromosphere and the limb darkened areas.

Also, in the image on the left (particularly the top left) - how can the prominences come up through the atmosphere without disturbing the atmosphere? Shouldn't the top of the atmosphere be ruffled rather than smooth?

Actually some parts are "ruffled up" quite a bit, particularly around the left side where the flare/CME is occurring. You'll also notice the distinct twisting effect of a "Birkeland current" in that large twister coming off the limb. That twisted shape is a direct result of the "current flow" through that plasma.
 
Am I the only one who finds MM's proposed test, um, bizzare?
Step 1: Go get the software that produced the high cadence/averaged RD image that is the first image on my website.

Step 2: Run the 171A channel of SDO through that routine.

Step 3. Take a HeII ion SDO image and subtract out the while light photosphere as was done in the composite image.

Step 4 overlay the remaining HeII image on the RD image just as was done with the published composite image.

Step 5: Count the pixels between the disk borders and the inside edge of the chromosphere.
As far as I can tell, MM is trying to show that the "171A" diameter of the Sun is less than its "chromosphere" diameter.

And he is trying to do with via a series of image subtractions (more later), rather than directly measuring those diameters!

In Step 1+2 position uncertainties are doubled (differencing is used, rather than stacking).

In Step 3 position uncertainties are again doubled.

In Step 4 an unknown - and possibly unknowable - uncertainty is introduced (MM appears to be unaware of the need for registration)

Step 5 is purely subjective (the two key terms - "the disk borders" and "the inside edge of the chromosphere" are undefined).
 
So, after that rather verbose preamble, my real purpose here is to speculate a little about what it would be like to spend a few hours or even days in person with some of the professionals here along with Michael Mozina regarding the subject of this thread. Would such a head-to-head environment be helpful for MM to better understand.....

What an interesting question.

Until the SDO program, I would have thought such an undertaking would be pointless. I have in fact gone down to LMSAL to a meeting on STEREO. It certainly didn't change my opinions any.

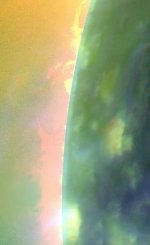
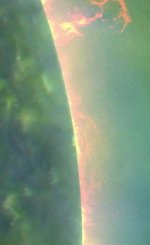
With SDO, however, I believe I could satisfy my own curiosity with a few hours or days of access to the full streaming video and that software routine from LMSAL that created the gold RD image on my website. That "equipment" and software routine would either convince me that I'm right, or it would convince me that I'm wrong, but it probably wouldn't even require any else to do it for me per se. I need to "see" to believe. That RD image will tell me one way or the other.

If after a couple of days of trying to convince others of the validity of this model based on the SDO images, I could not convince some folks at NASA to rethink their position, I'd be very surprised. I think that particular piece of gear might help make a difference, but "personal opinions" probably won't cut it from either side IMO.

There are however a number of scientific "tests" that might falsify this model for me, but I'd have to run them myself, or have someone at NASA help me run them in real time to change my mind.

IMO the RD process I cited, the one that uses the same technique used to create the gold RD image on my website is "the" definitive image. If the disk size is not smaller in diameter than the chromosphere diameter, it's curtains for the Birkeland solar model. If however the outline is smaller than the chromosphere diameter, it's curtains for the SSM model. IMO one test falsifies one of two solar models, and does so rather definitively. That's the "test" I need to see with my own eyes.
 
DRD is absolutely correct about one thing, there appears to be a fundamental philosophical difference between how the astronomy industry as a whole approaches astronomy and how I approach that topic or any scientific topic for that matter. From my perspective, regardless of the scientific topic that we happen to be discussing, the scientific process is supposed to work something like:

Observation->Need To Understand That Observation->Empirical Idea->Empirical Experimentation->Numerical Prediction->Observation To Falsify Or Verify Numerical Prediction->Lather Rinse Repeat Until Quantification Agrees With Observation.

You folks however have a philosophical, emotional, and actually a professional “need” to quantify anything and everything that you see in space, regardless of the empirical validity of your theories, and regardless of how well they actually jive with the observations. You’re definitely headed for a scientific disaster as I see things.

The mainstream’s order of “science” in astronomy today appears to go something like:

Observation->Need To Understand That Observation->Need For Quantification->Quantify Any Way Possible->Create Ad Hoc Entities And Skip Empirical Steps Altogether If Necessary->Ignore Observations In Conflict With Quantification If Necessary->Lather rinse repeat.

If you folks can’t explain an observation, say an observation of acceleration with known forces of nature, just make em up as you go and add math! Viola.
 
Plus - for him, a little math doesn't help. He knows that if he learns a formula or two, and shows them off here, we're likely to jump all over him for getting the units wrong, applying it where it doesn't apply, using completely wrong inputs, misinterpreting the results, etc. And we probably would, too.

So, he's stuck. He can't prove to the scientific community that he's right without math, but math is his critics' home turf.

In any war, or on any battlefield, “strategy” is everything. Sun Tzu would absolutely disapprove of me playing into your collective mathematical strengths. Trying to bark math on command around here would be like me trying to do a tap dance with everyone shooting at the ground beneath my feet. Sooner or later someone is definitely going to score a direct hit and make me look like a fool. That type of strategy would be an absolute disaster. Since no scientific theory rises or falls on my personal math skills anyway, what would that actually demonstrate even if you folks did score a direct hit or two? That’s a terrible strategy IMO and it produces nothing useful in the end in terms of knowledge for either you or for me.

If I want to win over the long haul, I cannot afford to foolishly play into your mathematical strengths. I need you to eventually play into my strengths, specifically the power of “pure observation” in satellite imagery. This particular crew seems to have forgotten all about the need for observation and the role of observation in science. SDO has provided me with a truly golden opportunity to test my theory for real and to make my case, and I intend to “seize the day” to the best of my abilities.

You folks seem to mistakenly believe that I personally am required to recreate a similar sized train load of math that you’ve come up with to describe the SSM to compete with the SSM. What you don’t seem to realize yet is that I personally do not have to do anything of the sort. All I actually have to do is pick off that opaque math bunny that you keep talking about in SDO observations. If I can disprove that one single math bunny, then your entire train load of SSM math becomes absolutely meaningless to you, and in fact it begins to work against you. You will eventually end up trying to use that train full of broken math to explain what cannot be explained with your broken math. It will only make the flaws in your math show up all that more obviously as we get into the observations. Those observations will falsify the SSM based on your own mathematical models. If that opaque math bunny goes down, the math related to the SSM becomes its own noose. It turns into a math bunny train wreck and I can just sit back and enjoy it. How nice is that? :)

If I had access to the FITS files at the moment, I could easily take that first light image, change the yellow ion setting to the color red and make your green limb line math bunny glow in pretty purple. I could do all kinds of color changes to the iron lines and we could watch those color changes play out inside your glowing math bunny disaster region. That would be really fun. :)

The other (more decisive) visual way to demonstrate the flaw in your math bunny is to use that RD technique which I have already mentioned to show that the outline of the RD disk matches up with that limb dimming region in the original 171A images, not the outline of the chromosphere. There are at least two good ways I can think of to finish off that math bunny.
 
Last edited:
Try this one: http://www.sai.msu.su/apod/ap070312.html (Jupiter, from New Horizons)

SL9 impact: http://zebu.uoregon.edu/images/r.mpg (may not be suitable without quite a bit of processing to register the individual frames).

For visual effect, I think it is very important to colourise the RD images (a linear grey scale will, of course, contain all the data, but since the sole basis for MM's nonsense claims is qualitative, visual impressions ...)


Yes. We've discovered that Jupiter has a solid iron surface!


(Or maybe this just goes to show that only a true dyed-in-the-wool crackpot would fall for the optical illusion created by the dark light pixel arrangement in a running difference graph.)
 
In any war, or on any battlefield, “strategy” is everything. Sun Tzu would absolutely disapprove of me playing into your collective mathematical strengths.

This is basically an admission that you're not interested in the truth, you're only interested in "winning".

Trying to bark math on command around here would be like me trying to do a tap dance with everyone shooting at the ground beneath my feet. Sooner or later someone is definitely going to score a direct hit and make me look like a fool.

You look like a fool anyways. But if you did a bit of math, maybe you'd actually discover something.

Since no scientific theory rises or falls on my personal math skills

They don't. But they DO rise or fall on math. Physics is a quantitative science. You can't do physics if you can't quantify it. Numbers matter.

If I want to win over the long haul, I cannot afford to foolishly play into your mathematical strengths.

No, Michael. Over the long haul, you will win if you're right. Doing the math will help show you if you're right. Your refusal demonstrates that you don't care about being right, you only care about winning. Basically, it's an attempt to justify your dishonesty.

I need you to eventually play into my strengths

No, Michael. You need to eventually discover the truth.

You folks seem to mistakenly believe that I personally am required to recreate a similar sized train load of math that you’ve come up with to describe the SSM to compete with the SSM.

No, Michael. It takes very little math to examine the basic parameters of your own model. Your refusal to do so indicates that you don't care about the truth. That is FAR more damning than any possible math mistake you could ever make.
 
DRD is absolutely correct about one thing, there appears to be a fundamental philosophical difference between how the astronomy industry
There is no such industry in the world.

You folks however have a philosophical, emotional, and actually a professional “need” to quantify anything and everything that you see in space, regardless of the empirical validity of your theories, and regardless of how well they actually jive with the observations.
This is gibberish. How is somebody meant to test how well theories agree with experiment without quantifying both?

Observation->Need To Understand That Observation->Need For Quantification->Quantify Any Way Possible->Create Ad Hoc Entities And Skip Empirical Steps Altogether If Necessary
Erm what? Step 1) "Observation" leads eventually to step 5) "Create Ad Hoc Entities And Skip Empirical Steps Altogether If Necessary". Michael how can step 5 possibly follow step one when state 5 says step 1) was ignored? The observation is the empirical step!

If you folks can’t explain an observation, say an observation of acceleration with known forces of nature, just make em up as you go and add math! Viola.
Double bass.
 
Yes. We've discovered that Jupiter has a solid iron surface!


(Or maybe this just goes to show that only a true dyed-in-the-wool crackpot would fall for the optical illusion created by the dark light pixel arrangement in a running difference graph.)

That is impressive, I can't help thinking of the possibilities.
Turning the technique on earth would give a whole new meaning to the term "iron grey clouds".

It also means that the stars are all fake, it is simply holes in the rotating iron shell, and space is really quite bright.
The sun is just a bigger hole, and this disproves that silly idea of the sun existing and much less having a iron shell.
 
There is more coronal loop activity on the right than on the left, at least along the limb lines.

You're asserting that the entire length of the limb in the right image has more coronal loop activity than ANY portion of the left image? The green line is visible along the entire limb in the left image, and nowhere in the right.

The light from the limb is simply "drowned out" by the light in the forefront part of the image.

If it's being drowned out by light, then the region in question should be brighter. But it's darker. At the bottom of the left image, there is, in fact, an area where the light green is nearly drowned out by foreground activity. And it's brighter, not darker.

If we happened to run that same image say a week later, it would be easy to spot the same limb darkening feature.

Your speculation about what another picture might look like is NOT evidence.

It's only because there is so much activity and light from in front of that limb that it makes it so difficult to observe.

Again, the sort of light that makes the image darker?

If however you look at my blog, I selected three different points around the clock that all show the same 4800Km gap between the bottom of the chromosphere and the limb darkened areas.

Those locations do not explain the 50 deg segment of the limb that lacks the green band.

Actually some parts are "ruffled up" quite a bit, particularly around the left side where the flare/CME is occurring.

No. The thing that you think is the bottom of the chromasphere is perfectly smooth over the entire 360 deg, including the region under the big flare.
 
Last edited:
In any war, or on any battlefield, “strategy” is everything. Sun Tzu would absolutely disapprove of me playing into your collective mathematical strengths.

Wow. Just wow. When I originally posted that, it never occurred to me that you would actually defend ignorance of mathematics and physics as being a virtue when it comes to understanding the universe.
 
Status
Not open for further replies.

Back
Top Bottom