• Security incident: ISF was recently accessed by intruders. Please change your password, and change it anywhere else you used it. Read more

Global warming discussion III

Status
Not open for further replies.
From a statistical point of view, how do you determine whether a tiny fragment of a trend is actually representative of an overall trend, or whether it's just variance at play? Isn't this sort of like trying to predict the 10-year trend of a stock by looking at 1 day? Ignoring of course, the fact that stocks are often random walks, and this is not :p
It's nothing at all like stock trends, and what you mean by "statistical point of view" escapes me.

If the climate changes it changes for a physical reason. The physical reason for the current warming is the enhanced greenhouse effect - just as was predicted from known physics. Statistics do not enter into that.

Basically, how do you tell that this tiny fragment of time is "off trend" when the error around trend is in terms of hundreds of years? It doesn't seem that it would be a robust and credible projection...
I'm afraid that's just meaningless.

When the world suddenly starts warming up people naturally wonder why, and scientists try to identify the cause. For instance, when the world warmed noticeably in the 1920's and 1930's scientists looked around for other things that had changed and might be relevant. They saw that solar activity had increased slightly after 1900 and some pointed to that as an obvious cause but when the numbers were worked out it wasn't sufficient. Then the decrease in volcanic activity from the very active 19th Century was noticed and when that was factored in the numbers did fit.

The case of current warming is very different in that both its cause and effect were identified before it happened. That's very strong evidence that the science is correct when added to the fact that no other change has been identified which could have the same effect.
 
It's nothing at all like stock trends, and what you mean by "statistical point of view" escapes me.
...
I'm afraid that's just meaningless.

"Trend" is a statistical concept. Any projection into the future is a statistical model. It assumes that past occurrences are indicative of future events.

What caused the warming prior to the last ice age?
 
I just ran the numbers for HadCRUT4.
OLS trend from 1998-2014 annual near surface temps is 0.0066 deg C per year.
OLS trend from 2000-2014 annual near surface temps is 0.0062 deg C per year.

Both well within margin of error and far smaller than the 0.02 deg C per year central prediction of the IPCC (and supposed long-term trend).
From the NOAA dataset the anomaly for Jan 2000 is 0.33C, the anomaly for Dec 2014 is 0.77C. That's 0.44C in just under 15 years. Makes you think, doesn't it?


I don't have the central projection from AR5 to hand but I very much doubt it's 0.2C per decade. More like 0.16, I'd have thought. No doubt someone can enlighten us.
 
"Trend" is a statistical concept. Any projection into the future is a statistical model. It assumes that past occurrences are indicative of future events.
Not in this case it doesn't. Future events are assumed to be effects of future causes and the delayed effects of previous ones. This is a physical issue, not a statistical one.

What caused the warming prior to the last ice age?
Look up Milankovich cycles; they're very interesting.
 
From the NOAA dataset the anomaly for Jan 2000 is 0.33C, the anomaly for Dec 2014 is 0.77C. That's 0.44C in just under 15 years. Makes you think, doesn't it?
Differencing individual months is a great way to amplify noise, yes. Not sure it teaches us much else though.

I don't have the central projection from AR5 to hand but I very much doubt it's 0.2C per decade. More like 0.16, I'd have thought. No doubt someone can enlighten us.
Ar4 central long term projection was 0.2. Ar5 made a short term projection of 0.16 when they realised they needed to do something to save face re the pause.
 
Isn't 8000 years kind of a drop in the bucket though? We're talking about cycles that take hundreds of thousands of years, aren't we? I admit I could be wrong, as I haven't done excessive amounts of research on this. Frankly, I don't think it's necessary to do huge amounts of research.

Why do you think "natural cycles" over such long periods would result in pronounced effects over a period of three or four decades?
 
What caused the warming prior to the last ice age?

CO2 - ice ages are triggered by slight changes in solar radiation, caused by orbital variation. However, changes in insolation in and of themselves are too weak to force the kinds of changes observed. Instead, they result in a slight cooling, oceans begin to cool and absorb more CO2, which causes more cooling and more CO2 being drawn down out of the atmosphere in a feedback effect. During the interglacials, the opposite is true, slight variations in solar energy - not strong enough in themselves to force change - result in a feedback whereby CO2 is degassed from the oceans.

This is prima facie evidence that strongly underpins what we know about the Earth's climate and how it responds to CO2. It is why geoscientists commonly refer to CO2 as the temperature knob of the climate. Without it then there is no way the planet could move between glacial/interglacial cycles in the way that it does. And understanding that link helps us to determine the likely consequence of raising atmospheric CO2 levels by (x) in the current climate.

So how is being neutral going to help anything NOW? Sure, part of the globe is no longer contributing to an increase... but the rest of the world is still increasing the problem, aren't they? It's still going to be going up.

Because change doesn't happen by magic, it actually requires first steps. There is also an issue of equity, whereby those parts of the world that have most profited from polluting the atmosphere should bear the greater burden, rather than shifting it onto the underdeveloped world who still grapple with real poverty.

What percent of the total CO2 output of the planet is coming from those sources?

Unfortunately for the line of argument you appear to be trying to advance here, energy and economics are inextricably linked. Per capita measurements matter because they have a bearing on the quality of life a society can enjoy. If you have a very carbon intensive lifestyle and live very well in a society of 20 million people, you can hardly tell a society of 1 billion people with very low carbon intensity (who happen to be the one's manufacturing all that stuff you love to consume) that they can never enjoy the same lifestyle as you. There is a fundamental issue of equity at play. If you in any way take the issue of poverty and development seriously then you have to address the fact that unless we figure out a way to reduce emissions and maintain growth then we are consigning two-thirds of the world's population to the "we don't give a ****" pile.
 
Last edited:
Basically, how do you tell that this tiny fragment of time is "off trend" when the error around trend is in terms of hundreds of years? It doesn't seem that it would be a robust and credible projection...

Well for starters, we have quite accurate 800,000 ka temperature proxies in the form of ice-cores, we can see that the changes in the composition of the atmosphere in the form of CO2 are off the charts compared to anything within that timeframe - and we can say with a lower degree of confidence that current levels have not been matched in around 7 million years. We have a huge amount of confidence in the physics of CO2 as a greenhouse gas, we know that when Co2 was this high in the past the world was considerably more tropical than it now.

Basically, being "off trend" is an irrelevancy because historical trends aren't the basis of climate science, they merely complement everything else we know about how the climate responds to change. The certainty around the human impact on the climate is based of a preponderance of evidence from many different streams.

There is a physical theory (CO2 traps heat, increasing CO2 should increase temperatures) that is confirmed by multiple observations. The observed rise in temperature is just one of those observations. The real crux of AGW theory is the physical model. Any alternative hypothesis around "natural" cycles would have to begin by explaining why that physical model is wrong, before coming up with causes for the observations supporting it.
 
Last edited:
Differencing individual months is a great way to amplify noise, yes. Not sure it teaches us much else though.
Indeed. 15 years doesn't tell us much at all and never did. Not about climate, anyway.


Ar4 central long term projection was 0.2. Ar5 made a short term projection of 0.16 when they realised they needed to do something to save face re the pause.
There's been no pause. 0.44C in just under 15 years does not a pause make.

If 0.16 is the current IPCC central short-term projection why did you say it was 0.2? The long-term projection has nothing to do with this conversation since we are discussing a short term; what the long-term outcome will be has not yet been revealed although I've got a strong feeling you won't like it.
 
CO2 - ice ages are triggered by slight changes in solar radiation, caused by orbital variation. However, changes in insolation in and of themselves are too weak to force the kinds of changes observed. Instead, they result in a slight cooling, oceans begin to cool and absorb more CO2, which causes more cooling and more CO2 being drawn down out of the atmosphere in a feedback effect. During the interglacials, the opposite is true, slight variations in solar energy - not strong enough in themselves to force change - result in a feedback whereby CO2 is degassed from the oceans.

This is prima facie evidence that strongly underpins what we know about the Earth's climate and how it responds to CO2. It is why geoscientists commonly refer to CO2 as the temperature knob of the climate. Without it then there is no way the planet could move between glacial/interglacial cycles in the way that it does. And understanding that link helps us to determine the likely consequence of raising atmospheric CO2 levels by (x) in the current climate.
Thank you.

Because change doesn't happen by magic, it actually requires first steps. There is also an issue of equity, whereby those parts of the world that have most profited from polluting the atmosphere should bear the greater burden, rather than shifting it onto the underdeveloped world who still grapple with real poverty.
That's not where I was going - sorry if I was unclear. I meant, why only neutral, why aren't we trying to go beyond neutral? I mean, neutral isn't going to help in the long run, will it? We need to reverse it, which would mean carbon "negative" or whatever, right?

Unfortunately for the line of argument you appear to be trying to advance here, energy and economics are inextricably linked. Per capita measurements matter because they have a bearing on the quality of life a society can enjoy. If you have a very carbon intensive lifestyle and live very well in a society of 20 million people, you can hardly tell a society of 1 billion people with very low carbon intensity (who happen to be the one's manufacturing all that stuff you love to consume) that they can never enjoy the same lifestyle as you. There is a fundamental issue of equity at play. If you in any way take the issue of poverty and development seriously then you have to address the fact that unless we figure out a way to reduce emissions and maintain growth then we are consigning two-thirds of the world's population to the "we don't give a ****" pile.

That's not where I was going, really. I was looking at it from a global view - maybe we should be making an effort to provide other nations (who have an aggregate total effect that is large) with a jump over that bit.

I seem to have walked all unknowing into a hornets nest. I gather that you lot are so used to banging your heads against the wall of denial that you assume any question to be an argument from your opponent. I'm not as knowledgeable on this, I don't think it's really all that worthwhile for me to do a huge amount of research on something I'm already sold on, so there are lots of gaps. I'm also a nerd, and prone to question everything. But I'm not your enemy here, so... ?
 
Well for starters, we have quite accurate 800,000 ka temperature proxies in the form of ice-cores, we can see that the changes in the composition of the atmosphere in the form of CO2 are off the charts compared to anything within that timeframe - and we can say with a lower degree of confidence that current levels have not been matched in around 7 million years. We have a huge amount of confidence in the physics of CO2 as a greenhouse gas, we know that when Co2 was this high in the past the world was considerably more tropical than it now.

Basically, being "off trend" is an irrelevancy because historical trends aren't the basis of climate science, they merely complement everything else we know about how the climate responds to change. The certainty around the human impact on the climate is based of a preponderance of evidence from many different streams.

There is a physical theory (CO2 traps heat, increasing CO2 should increase temperatures) that is confirmed by multiple observations. The observed rise in temperature is just one of those observations. The real crux of AGW theory is the physical model. Any alternative hypothesis around "natural" cycles would have to begin by explaining why that physical model is wrong, before coming up with causes for the observations supporting it.
Thank you.
 
Why? What is the physical basis for your doubts?

You've already explained it, so it's not really apt anymore.

But for curiosity sake, the impetus was due to me having set trend rates for medical insurance. There's a lot of noise, because there's not solely one cause for the observed trend - it's not just "inflation" in any normal sense of the word. There's unit cost inflation - how much doctors want their prices to go up for the same service year over year. But there's also changes in utilization due to advertising/new info/changes in medical practice etc., changes in the severity mix, changes in the induced utilization due to benefit changes, and changes in the mix or degree of negotiated reimbursement rates.

There's an underlying trend that can be seen... but only on a long enough time scale. We end up using 5 to 10 years of data to walk in to our underlying trend, and we have to control for all those other factors. If we tried to set trend based on just one year's worth of data, we'd be wildly inaccurate and basically just throwing a dart.

I was assuming that the "trends" in discussion here were a similar thing - a statistical trend rate. Based on that, trying to determine trend based on a couple of decades would be like me trying to set medical trend based on a week's worth of information.

But it seems to be the case that your "trend" and my "trend" aren't the same animal.
 
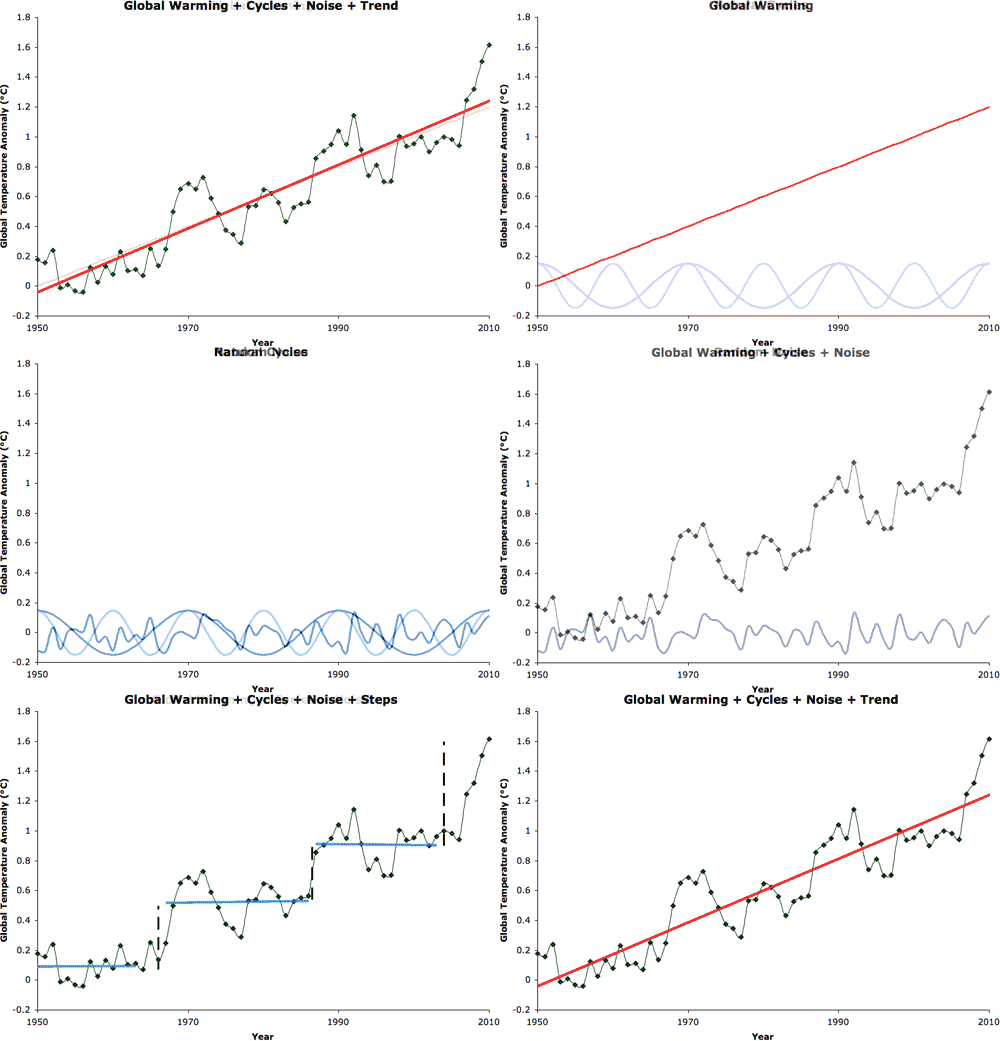
The noise in the climate signal comes from internal variability (i.e. "weather", oscillations in ocean currents, sunspots etc), but the time span those processes play out over can be smoothed out over 30 year periods, revealing the background trend. There are some cool infographics on this, I'll see if I can dig them up.

ETA:

These two are quite good

StepFnv2_500.gif

This animation refutes the myth that the global temperature record is somehow explained by "climate shifts" or "step functions", when in reality the record is physically explained by an underlying long-term trend of increasing temperature (global warming caused by human greenhouse gas emissions) plus the superimposed effects of noise and natural cycles such as the El Nino Southern Oscillation (ENSO) and the solar sunspot cycle. Using simulated temperature data to illustrate how these physical factors combine to explain the appearance of the real temperature record, the frames show: 1) a 0.2°C per decade global warming trend; 2) two "natural cycles" of amplitude 0.15°C and periods of 10 and 20 years; 3) random noise of amplitude 0.07°C; 4) the sum of the warming trend, cycles and noise (the simulated temperature record); 5) a fit to the sum using a step function given by 3 linear trends from 1950-1963, 1967-1986, and 1987-2003 (light blue); and 6) a linear fit to the entire time period 1950-2010, which has slope 0.21°C per decade (red). The fit to the complete simulated temperature record in frame 6 is almost identical to the assumed global warming trend of 0.2°C in frame 1, just like the situation in the real world where short-term cycles and noise don't contribute to the long-term global warming trend.

FR11_All_500.gif

Five datasets of global surface temperature and lower troposphere temperature are shown in this animation before and after removing the short-term effects of the El Niño Southern Oscillation (ENSO), solar variability, and volcanic aerosols. A 12-month running average was applied to each dataset. Foster and Rahmstorf (2011) used multiple linear regression to determine and then statistically filter out these short-term effects to reveal the steady underlying trend of primarily human-caused global surface warming. This method effectively removes the short-term noise that can complicate the interpretation of temperature trends or permit "cherry picking" of graph endpoints or short time periods to find periods that erroneously suggest global warming has paused rather than continued unabated as these results show.
 
Last edited:
Yet at the same time Emily we have very long scale trends arising from multiple lines of equiry reaching back to the end of the last ice age.

29084301.jpg


You can see the Holocene optimum ( the hump ) and the slow orbital decline from Milankovich cycles that would, if not for our involvement, eventually lead into another ice age.

Then the industrial age came along about 300 years ago and we reversed that decline in a blink of a geological eye.

We've delayed or cancelled the next ice age and altered the climate at least 3,000 years out....and the heat level continues to climb

decadal-and-yearly-warming-noaa.jpg


These are long baselines.....and it's undeniable.

It's getting warmer
We're responsible.
 
That's not where I was going - sorry if I was unclear. I meant, why only neutral, why aren't we trying to go beyond neutral? I mean, neutral isn't going to help in the long run, will it? We need to reverse it, which would mean carbon "negative" or whatever, right?
Correct. That will need to be done, but not a fossil fuel issue. That is an ecosystem services issue.

Regulating services
"Benefits obtained from the regulation of ecosystem processes"

carbon sequestration and climate regulationwaste decomposition and detoxification
purification of water and air
pest and disease control
 
I'm fascinated by the belief that adding 1998 has a big impact on the trend. Even an IPCC lead author made this claim on twitter the other day. You'd think a scientist would know a single point makes little difference to a trend.

I just ran the numbers for HadCRUT4.
OLS trend from 1998-2014 annual near surface temps is 0.0066 deg C per year.
OLS trend from 2000-2014 annual near surface temps is 0.0062 deg C per year.

Both well within margin of error and far smaller than the 0.02 deg C per year central prediction of the IPCC (and supposed long-term trend).

The "cherry pick" makes next to no difference to the result whatsoever, and remains well below the late 20th century trend. It doesn't surprise me when laypeople on internet forums aren't intimately familiar with fitting trends, but an experienced scientist should really know better.


NOAA's 'Climate at a glance' tool enables you to plot any of its data and calculates the trend line for you. I used it to calculate the 15 year trend for the years around 1998.

1996-2010: +.12 C per decade
1997-2011: +.05 C per decade
1998-2012: +.04 C per decade
1999-2013: +.07 C per decade
2000-2014: +.07 C per decade

The largest trend is three times the smallest, so clearly which year you cherry pick to start at does make a considerable difference to the short term trend.

Climatologists say you need to look at periods of at least 30 years for noise to cancel out and underlying trends to reliably emerge, so here are the 30 year trends:

1981-2010: +.17 C per decade
1982-2011: +.17 C per decade
1983-2012: +.16 C per decade
1984-2013: +.16 C per decade
1985-2014: +.15 C per decade
 
Originally Posted by Emily's Cat View Post
That's not where I was going - sorry if I was unclear. I meant, why only neutral, why aren't we trying to go beyond neutral? I mean, neutral isn't going to help in the long run, will it? We need to reverse it, which would mean carbon "negative" or whatever, right?

Very very difficult and has it's own set of consequences as it also is anthro.

Tangled in this is not only carbon but sustainable as well. Start with the lower hanging fruit and move out of coal which has not only carbon implications but many other negative consequences for the environment.

Inevitably society will be carbon neutral is we burn it all. Not a pretty outcome.

Emily - read through this to understand the long term consequences of carbon.

http://www.nature.com/climate/2008/0812/full/climate.2008.122.html

There is really no way back that has any practical possibility.

The climate IS altered.....it's how fast the consequences unfold that we are dealing with...IF we can get to a renewed radiative balance around 2 degrees C - then we have a new climate regime that is relatively stable...not a lot different than the Holocene optimum .some 8,000 years ago when civilization blossomed, - our biome can generally handle that.

Moving into the unknown territory of 3+ C - a global temp not seen in millions of years.....that's the risk that the world is trying to avoid.
 
Last edited:
Indeed. 15 years doesn't tell us much at all and never did. Not about climate, anyway.


There's been no pause. 0.44C in just under 15 years does not a pause make.
What I was criticising is your decision to difference two months some way apart, then make a declaration on that basis.

I picked GISTEMP land and ocean (why not shake up the series a bit). Using their data, Jan 2000 to Jan 2014 differenced gives +0.46 deg C - about the same as NOAA (unsurprisingly, since their source data are similar). Data are here.

But then we look at Feb 2000 to Feb 2014 - just one month on - and the difference is -0.13 deg C. If we are to believe this as a useful metric, one month the pause has gone, the following month the pause is back and we actually have cooling.

And I can choose months that give even more absurd results. I would pick Feb 1998 as a start point, but I don't want the peanut gallery to spit all of their coffee out, so I'll choose Feb 1995 instead. Feb 1995 to Feb 2014 gives me a delta of -0.32 degrees. What does this tell me about global warming? Short answer: just like your delta, absolutely nothing of any use at all. So why are you claiming that this delta shows the pause didn't happen?

If 0.16 is the current IPCC central short-term projection why did you say it was 0.2? The long-term projection has nothing to do with this conversation since we are discussing a short term
Since you may have forgotten, I responded to a specific claim you made:

15 years is actually from Jan 2000 to Jan 2015 during which warming has been above the long-term trend.
So, I apologise for selecting the long-term trend in response to your claim about the long-term trend. Now we've clarified that by "long-term trend" you didn't actually mean "long-term trend", I will concede the use of 0.16 deg C per decade. Note: it doesn't change my conclusions one bit. 0.066 deg C per decade is still smaller than 0.16 deg C per decade. So the trend in that period - rather than the delta (which can't tell us anything, as explained above) is most certainly below the long term trend AND the short-term projection of the IPCC.
 
Status
Not open for further replies.

ISF - Join now!

Every member here is approved by hand. No bots, no spam, just people who care about evidence and honest debate.

Membership is free!

Create your free account

Back
Top Bottom