Newly published research in ’PNAS’ identifies what authors call a ‘vertical human fingerprint’ in satellite-based estimates of atmospheric temperature changes, adding still more to confidence levels about human influences in warming.
A new research paper by Lawrence Livermore National Laboratory climate scientist Ben Santer and co-authors looks in detail at how climate change resulting from human activities is affecting the temperature of Earth’s atmosphere.
They argue in their paper in the Proceedings of the National Academy of Sciences (PNAS) that natural climate forcings like volcanoes, El Niño, and changes in solar activity could not have been responsible for the cooling of the upper atmosphere and warming of the lower atmosphere, and they identify a clear human “fingerprint” to the warming seen over the last 30 years.
While observational data from satellites show less warming than predicted by most models, Santer and his co-authors demonstrate that the observed warming is consistent with models including both human and natural forcings, but inconsistent with models using only natural forcings and variability.
To determine effects of both natural climate forcings and the human contribution, the researchers examined global climate model runs from the latest set of models, known as CMIP5, produced for the IPCC Fifth Assessment Report. They compared temperatures at different layers of the troposphere — the lower part of the atmosphere to six or so miles up — and lower stratosphere (between six to 30 miles up). They looked at both the standard model runs, which include anthropogenic (human-caused) and natural forcings, and also at runs that only include natural forcings. That approach let them try to isolate the anthropogenic component of warming, allowing them to see if it was statistically significantly different from what likely would have happened in the absence of human activities.
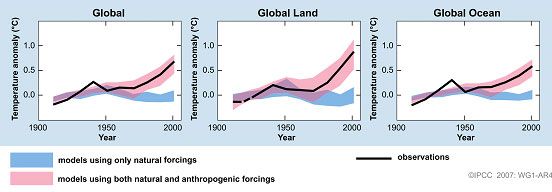
Their research approach has been used extensively before, but applied mainly to surface and ocean temperatures. The figure below, taken from the 2007 IPCC report, shows model runs with only natural forcings; model runs with all forcings; and observations of surface temperatures for the whole globe — land areas and ocean areas. The fifth IPCC report was expected to expand these graphs by showing a similar chart for deeper ocean temperatures (0 to 2000 meters).
In all cases, the observed temperatures are generally consistent with model runs incorporating all forcings and notably inconsistent with runs using only natural forcings.
.png/400px-Ocean_Heat_Content_(2012).png)