I analyze images for a living (at least I did before I retired), and I am well aware of how to do it. You, however, are not. if you think that what we are doing is "image analysis", you're crazy.
How can we "analyze" anything if you can't find the image Tim?
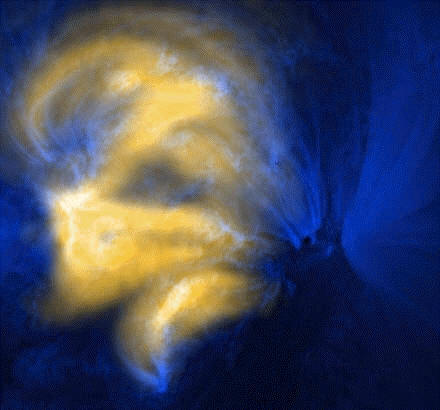
Both bright features, especially the one above the loop, look to me like they are suspended above the sunspots.
Well, clearly some of the loop is located above the sunspot and photosphere. The fact the photosphere is brightly lit up at the point where the loops come though suggests that the loops traverse the surface of the photosphere too. Why else is the photosphere lit up like that with a pattern that relates to the sunspot features in the photosphere?
I don't see any reason to believe that they extend below the photosphere.
Why is the photosphere itself "lit up" like that? Did you look at the image before this image and look at the area under the loops, at the surface of the photosphere? Did you notice any changes between the frames?
The loop is obviously suspended above the sunspot, and does not even look like it touches the surface at all, though the imagery is not really clear enough to tell.
Well, if the loops traverse the surface of the photosphere that would certainly explain why the photosphere is brightly lit up on both sides of the loops.
As for the photosphere around the sunspots, it looks like some of the high contrast features are brighter in the flare image than they are before or after.
There are two primary features I expect you to observe in that image. First there is a "ribbon" of light visible in that image that precedes the actual flare image. Prior to these two images, the photosphere in that area looks "normal". Only in two frames does the photosphere "light up" and it's not in the same pattern. Why?
Secondly the photosphere material under the loops is visually "different" under the loops between the previous frame and this image. That is consistent with the idea of a the coronal loops blowing this material up and away from the surface in that area.
It would be nice to have higher time resolution data to see which comes first, the flare of the brighter features. As it is, the pre-flare frame precedes the flare by 19 minutes,
Even 19 minutes earlier we can see changes occurring in the light patterns of the photosphere.
and the post flare image follows over 29 minutes later.
So the whole show is over in less than an hour and we have three frames to work with, four if you count the frame precedes the preflare image. Every detail counts.
The entire event sits in just one frame,
Well, actually it's two frames. There is a change in the photosphere in the preflare frame that is not visible in the previous image. Something is happening even in the preflare frame that is "different' from previous frames.
so it is quite impossible to know how the events are ordered in time.
Well, the image we have or ordered in time and whatever physical model we come up with should fit these observations.
The problem is that this is not an objective "analysis", but rather a purely subjective interpretation of what the image "looks like".
Not completely. It's no longer "subjective" as to whether or not loops are visible in WL images. That wasn't true last week, but this week at least, we all seem to see the loops in white light. The "look like" coronal loops to me, do they look like coronal loops to you? Some things we can already agree upon.
Furthermore, you are trying to lay claim to a physical process ordered in time, from a single snapshot image.
No, I'm trying to point out that the white lit up regions around the loops where they reach the photosphere suggests that the loops are "lit up" far below the photosphere. I'm not actually doing any of this from a "single" image, but rather at least three images, and actually the image prior to the preflare image. It's also based upon watching what happens in this even on *ALL THE OTHER WAVELENGTHS*. I've actually sat through the whole video at least twice in the past week, and I doubt any of you have actually see the whole DVD even once.
We have no image data, just pictures.
We can get all the "image data" we need, but there are physical things that can be observed in "just pictures". A 'picture" can show us a lightening bolt too.
Is the brightening of the photosphere real, and /or significant?
Yes and yes. It is real because the loops traverse the photosphere and there is additional current flowing through these regions than other areas of the photosphere. It is significant because it demonstrates that the loops originate (and could therefore be visible) far *below* the photosphere.
If we had real image data, we could ratio or difference the images and see at once. If we knew how or if the gain of the instrument changes from frame to frame we would know a lot more. If we had higher time cadence data we could actually see the timeline of events. Real image analysis requires real data and real data processing. There was a time in history when looking at an image was all that one could do. But those days are long gone. If you are seriously trying to seriously advance a serious scientific alternative to standard physics, then you have to act serious; stop playing with pictures and start really analyzing images. The "callous disregard for imagery analysis" here is all yours, along with a callous disregard for science and physics.
You know Tim, none of that grandstanding sounds particularly impressive coming from you after you were so sloppy in your original "analysis' that you had no clue that there were even any white light images on the whole DVD. I think you better come down off that soapbox and also start 'acting serious' if you expect to really analyze these images.
I have already spent more time on this today than it's worth. Other things call.
I hear you on that point.
FYI, I see that I missed one of your earlier responses to my questions about Kosovichev's Doppler video. I have several comments to make about that post, but it will have to wait.
)
")