You are using an out of date browser. It may not display this or other websites correctly.
You should upgrade or use an alternative browser.
You should upgrade or use an alternative browser.
Merged Discussion of femr's video data analysis
- Thread starter tfk
- Start date
I always learn something in these threads, but the phrase "counting the number of angels dancing on the head of a pin" comes to mind.
The only question is "Is this me or femr ...?"
http://www.youtube.com/watch?v=b2d9TO126EE&NR=1

tom
ozeco41
Philosopher
I always learn something in these threads, but the phrase "counting the number of angels dancing on the head of a pin" comes to mind.
And, If I Recall Correctly, the main reason we are down this track of detailed methodology is because a lot of truther claims are based on the premise that "free fall acceleration" == "demolition"
....that premise is false (Attention Chandler, Szamboti et al)
So determination of freefall or not does not affect the outcome of "was it demolition or not?"
That said the scientific debate is of interest of itself.
All same the "nano thermate residue or paint chips" debate. Interesting but of zero relevance to the question "demolition or not?"
OZ,
That is absolutely right.
Femr, would you agree with this?
One interesting thing that occurred to me during my look at the numbers is that both Chandler and NIST's early numbers & graphs require not only FFA, but faster than FFA.
viz., If, over the course of ~ 2.25 seconds the AVERAGE acceleration (as given by a Least Squares Linear fit) is substantially equal to "G" [true], and the standard deviation of the data is not equal to zero [also true], then the acceleration at some points in the data set MUST represent an acceleration greater than "G".
There are three possible explanations for this occurrence:
1) The average acceleration is really < G. That is, the error in the average acceleration is sufficient large to allow variations in the instantaneous acceleration such that it never exceeds "G",
2) The average acceleration is really ~"G", but the calculation of instantaneous acceleration has sufficient error that the standard deviation is really approximately equal to zero, and the instantaneous acceleration over the entire interval is really a constant "G", as well.
3) The instantaneous accelerations over some parts of the interval are less than "G", requiring the instantaneous accelerations over other parts of that interval to be greater than "G".
As I looked at the data, it became evident to me that options 1) & 2) were untenable. The only viable explanation is that there were short periods of time when the acceleration was really > "G".
Femr, do you agree with this?
Try telling a truther that this can happen without violating Newton's Laws ...!!
tom
Last edited:
Depends what *this* is...Femr, would you agree with this?
Not from my perspective. My reason for performing the tracing is to determine accurate metrics on building movement. Application of the same methods to early motion of WTC1 has proven very insightful and has highlighted numerous inaccuracies with the NIST analyses. Understanding actual movement can only be helpful in understanding the actual events. Performing similar for WTC7 will help clarify numerous behaviours, such as the timing between corner release points.ozeco41 said:the main reason we are down this track of detailed methodology is because a lot of truther claims are based on the premise that "free fall acceleration" == "demolition"
*freefall* was determined a long time ago, and is not really my focus. I'm more interested in what *else* can be determined by looking at early building motion. The current focus on descent rate has simply evolved out of bits of discussion about the validity of the tracing methods.So determination of freefall or not does not affect the outcome of "was it demolition or not?"
It may be that conclusions are more in the form of what did not happen, rather than what did. For example the easily observable (and traceable) *flexing* motion of the facade prior to east penthouse descent would indicate that whatever caused that descent occurred quite a period of time before release of the penthouse itself. May seem like an obvious statement, but there has not been any actual verifiable data on such points to date.
The data does seem to indicate periods of over-G acceleration. A couple of factors not presented are...As I looked at the data, it became evident to me that options 1) & 2) were untenable. The only viable explanation is that there were short periods of time when the acceleration was really > "G".
Femr, do you agree with this?
a) Scaling metrics. We're at the mercy of very scant building measurements, and even minor error in scaling could result in significant change to derived acceleration data.
b) Camera Perspective. Again scaling related, but there is no treatement of the data wrt perspective. From the Dan Rather viewpoint it won't make a *huge* difference, but if included it would make *some* difference.
c) Other unknowns, such as whether the video framerate is *exact*. Very slight difference between the actual *original* framerate and the available video could skew results.
----
Do you still have any doubts about whether the positional data is sub-pixel accurate ? I'm still comfortable with the suggested +/- 0.2 pixel accuracy.

----
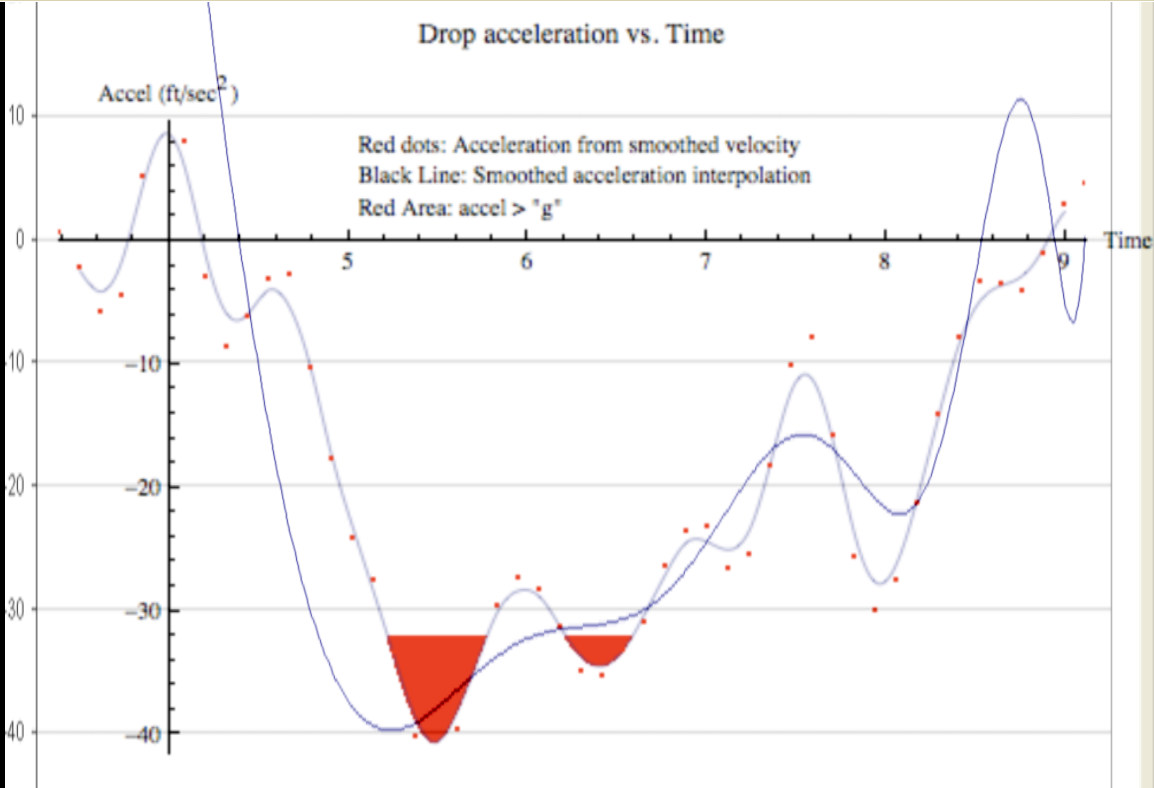
Are you clear on the units of the previous acceleration graph now ? (ft/s^2 rather than G).
----
Am still looking at scaling metrics, but the biggest stumbling block is a ridiculous lack of building measuement data. The next biggest stumbling block is the low resolution of the videos, which limits the accuracy possible when determining feature measurements. That's further compounded by the fact that we cannot really use sub-pixel positional methods, as they are only useful for determining changes in position, not static position. I've developed procedures to drastically improve static image quality (stacked image summation for example), but there are limitations of course.
Does anyone know where I can find WTC 7 building measuement data ? (That should hopefully include accurate per-floor heights)
A first stab...
Graph of original distance/time data and order 50 poly fit...

A 5964*3720 pixel version so you can actually see what's occurin...
http://femr2.ucoz.com/WTC7DanRatherDrop.png
Derived Velocity (uses dydx function of PFit Excel Plugin)

Derived Acceleration (uses ddydx function of PFit Excel Plugin)

Quick overlay comparison to your acceleration curve...
Graph of original distance/time data and order 50 poly fit...
A 5964*3720 pixel version so you can actually see what's occurin...
http://femr2.ucoz.com/WTC7DanRatherDrop.png
Derived Velocity (uses dydx function of PFit Excel Plugin)
Derived Acceleration (uses ddydx function of PFit Excel Plugin)
Quick overlay comparison to your acceleration curve...
Why are accurate measurements of movement and drop curves important?
In the case of WTC1:
They can show that the collapse initiation for WTC1 happened very differently than what the NIST claimed.
They claim an 8 degree tilt over which all columns initially failed but measurements show it was less than 1 degree.
Multiple drop curves allow us to synchronize the order of observed column failures. For example, if we compare drop curves of 4 anchor points on WTC1 (on the NE corner, the NW corner, the SW corner and on the antenna), we can see that massive failure inside the core is what most probably caused the collapse of WTC1, not the loss of the south wall as the NIST claims.
If we measure correctly we can see that all 60+ columns in the west wall of WTC1 must have failed together within a 0.5 second interval. We will see that the first row of forceful ejections come out from the 98th floor before any point on the perimeter begins to move downward and before the antenna begins to move downward.
We will see that the true sequence of events is totally different from what the NIST report claims.
In the case of WTC7: Order and interval between events can be established using multiple trace points to establish what events are simultaneous or near simultaneous. This can be compared to the NIST description and models to show that the current collapse simulations are a work of total fantasy when compared with the real event.
In short, we will see that we should have been measuring these things years ago to check the NIST's work.
Last edited:
DGM
Skeptic not Atheist
Major Tom:
Please do not post here unless you can post with the same caliber that has been displayed so far.
Others, This is the first thread in years that shows some promise of being educational. Do not respond to typical "truther" bait.
I have reported Major Tom.
Please do not post here unless you can post with the same caliber that has been displayed so far.
Others, This is the first thread in years that shows some promise of being educational. Do not respond to typical "truther" bait.
I have reported Major Tom.
What for ? ozeco41 brought up why tracing was being performed. I brought up it's prior usage for collection of data for WTC 1. MT posted opinion on some of that data.I have reported Major Tom.
Perhaps better to leave WTC 1 until *discussion of femr2's video data* has reached the end of the current WTC7 focus, and perhaps better to see what actually falls out the bottom of the WTC7 tracing before predicting the results, but don't see anything there to report.
Much more relevant to the thread than the chin-wag about film titles and poster age a little earlier on.
Suggest we simply all refrain from off-topic posts (which ironically should include this one from me
") )
)Notes on scaling...
The Dan Rather data is scaled relative to this measurement...

I've set it to 344ft in the spreadsheet data provided, which is based upon the only distance metrics available (to me).
Again, if anyone has information which will allow a more precise distance to be determined, fire away.
I use a metric provided by NIST (242ft - roofline to top of windows on floor 29) with an addition of a multiple of their stated general floor height (12ft 9in) to account for the increased portion visible at the West edge.
The Dan Rather data is scaled relative to this measurement...
I've set it to 344ft in the spreadsheet data provided, which is based upon the only distance metrics available (to me).
Again, if anyone has information which will allow a more precise distance to be determined, fire away.
I use a metric provided by NIST (242ft - roofline to top of windows on floor 29) with an addition of a multiple of their stated general floor height (12ft 9in) to account for the increased portion visible at the West edge.
A brief conclusion that I'll post here.
Hopefully tonight or tomorrow, I'll be able to spring the time to write up a summary that shows the effects of various filtering techniques (applied to the raw position vs. time data) on the calculated velocity & position (vs time) curves.
It's actually kinda sorta interesting, and it does seem to converge on a solution that is reliable.
But here's the conclusion:
Acceleration of the WTC7 North Wall compared to Free Fall Acceleration:

The results are conclusive: the wall dropped nothing like an object in free fall.
Not for 2.25 seconds.
Not for 1 second.
Not for 0.1 seconds.
It is correct to say that "for about 2 seconds (from 5 to 7 seconds, by this time index), the average acceleration of the wall was close to free fall."
But the claim that "the wall fell at FFA for 2.25 seconds" is not supported by this data.
tom
Since it's easy to calculate (now that I've got the accel. function), here is a table of the "Average Accelerations over 2.25 second intervals", for start times running from 4.6 sec to 5.6 seconds.
{Interval Start time, Average Acceleration over 2.25 sec interval }
{4.6, -28.6556},
{4.7, -29.5611},
{4.8, -30.2888},
{4.9, -30.8012},
{5.0, -31.0492}, *** max value
{5.1, -30.9424},
{5.2, -30.3447},
{5.3, -29.3036},
{5.4, -28.0272},
{5.5, -26.8454},
{5.6, -26.0467}
One can see that the "average accel over 2.25 sec interval" peaks out for the interval starting at 5.0 seconds (5.0 -> 7.25 second interval) at 31.05 ft/sec^2.
Or about 100 * 31.05/32.18 = 96.5% G.
tom
Note that the above are from femr's previous WTC7 (Camera 2 "Dan Rather") data set.
It'll be easy to run the results on his latest data sets some time in the next couple of days.
Notes on scaling...
The Dan Rather data is scaled relative to this measurement...
http://femr2.ucoz.com/_ph/3/263595510.jpg
I've set it to 344ft in the spreadsheet data provided, which is based upon the only distance metrics available (to me).
Again, if anyone has information which will allow a more precise distance to be determined, fire away.
I use a metric provided by NIST (242ft - roofline to top of windows on floor 29) with an addition of a multiple of their stated general floor height (12ft 9in) to account for the increased portion visible at the West edge.
I'd suggest that there are too many complications on the roof to know what point NIST is talking about. There is a roof line & also a parapet wall.
I'd suggest that you use the distance from the top of a low story window to the top of an upper story (not the 47th story, perhaps the 45th or 46th floor) window. Again, there are differences in the top floors for mechanical reasons.
jaydeehess
Penultimate Amazing
And, If I Recall Correctly, the main reason we are down this track of detailed methodology is because a lot of truther claims are based on the premise that "free fall acceleration" == "demolition"
....that premise is false (Attention Chandler, Szamboti et al)
So determination of freefall or not does not affect the outcome of "was it demolition or not?"
Spot on. It is a very large leap of intuition from a ffa to controlled demolition. Such a leap belies a prejudice in the person making such a leap.
OZ,
That is absolutely right.
.........There are three possible explanations for this occurrence:
1) The average acceleration is really < G. That is, the error in the average acceleration is sufficient large to allow variations in the instantaneous acceleration such that it never exceeds "G",
This was the reasoning for my starting the thread asking about Chandler's (non-)handling of error margins. There was no calculations indicating the accuracy of huis work which makes his work all but useless.
2) The average acceleration is really ~"G", but the calculation of instantaneous acceleration has sufficient error that the standard deviation is really approximately equal to zero, and the instantaneous acceleration over the entire interval is really a constant "G", as well.
3) The instantaneous accelerations over some parts of the interval are less than "G", requiring the instantaneous accelerations over other parts of that interval to be greater than "G".
As I looked at the data, it became evident to me that options 1) & 2) were untenable. The only viable explanation is that there were short periods of time when the acceleration was really > "G".
Which indicates that some other influences are in effect that most certainly cannot be 'explained' away by the introduction of explosives or incindiary devices.
........
Try telling a truther that this can happen without violating Newton's Laws ...!!
tom
Goes back to the prejudices of the persons jumping to conclusions. If one's world view demands large complicated and overly complex conspiracies by secret organizations (in the '50s this would be the 'Commie under every rock' senario, now its the NWO/Illuminatti/Bilderberger/etc.) then such leaps come easy. I, and others, on the other hand require much greater proof of asuch fantastical conspiracy and instead regard this data as inconclusive concerning the cause of the collapse.
That said, is there a handling of the margin of error in the final graph of acelleration vs. time, or has the minute detailing simply reduced such error margin to a degree such that the margins are insignificant?
Do all of the positional points require no movement towards or away from the camera and that all movement be either vertical or lateral wrt to the videio frame? If the structure's measurement points were moving left/right and up/down then they were also moving front back and would not such movement, unmeasurable in a 2-d video rendering, affect the accuracy in the vertical measurements?
(probably answered above , forgive me if you guys lost me )
Okay, though I'll highlight at this early juncture that our acceleration curves look quite different. I get similarly shaped results from the NIST Cam #3 viewpoint as well, using a few different methods.Hopefully tonight or tomorrow, I'll be able to spring the time to write up a summary that shows the effects of various filtering techniques (applied to the raw position vs. time data) on the calculated velocity & position (vs time) curves.
It's actually kinda sorta interesting, and it does seem to converge on a solution that is reliable.
Please provide the data/equations which describe the curves, and an R2 value if possible.
Okay, though I think there are many other questions that can be asked of the data. Okay with *a* conclusion ?But here's the conclusion
Okay, though think it should be made clear in text that over-G is present, and that it refers to the NW corner, not the wall.It is correct to say that "for about 2 seconds (from 5 to 7 seconds, by this time index), the average acceleration of the wall was close to free fall."
Agreed, and such a simplistic conclusion could never be true anyway. It's clear that behaviour varies slightly depending upon what point along the roofline is selected.But the claim that "the wall fell at FFA for 2.25 seconds" is not supported by this data.
Again, careful Tom. You've generated *an* acceleration function. Mine is slightly different...Since it's easy to calculate (now that I've got the accel. function), here is a table of the "Average Accelerations over 2.25 second intervals", for start times running from 4.6 sec to 5.6 seconds.
I think that going from where we were to where you appear to be now is a leap premature.
We should have spent at least a couple of weeks looking at various smoothing and noise reduction methods.
On that basis, I'm treating your current acceleration curve as *tfk acc #1*, not *the* accel function.
What time interval does each row span ? 0.1s ?{Interval Start time, Average Acceleration over 2.25 sec interval }
Obviously results from my accel curve differ to this. (with over 1s averaging over-G)96.5% G.
We will have to thrash the procedures around until we both converge on similar results.
Would be a tad useful if your processing steps from position/time data are described in detail, along with inclusion of resultant data. Quite happy to do the same of course.It'll be easy to run the results on his latest data sets some time in the next couple of days.
Last edited:
When applied to their own tracing process, absolutely. In determination of their provided metric, no. They state they determined that from structural drawings of the building. A copy of such would be handy, but...I'd suggest that there are too many complications on the roof to know what point NIST is talking about. There is a roof line & also a parapet wall.
Have you got any facade measurements for WTC 7 ? Extra details very welcome.I'd suggest that you use the distance from the top of a low story window to the top of an upper story (not the 47th story, perhaps the 45th or 46th floor) window. Again, there are differences in the top floors for mechanical reasons.
If the NIST 242ft metric is accurate, and the NIST 12ft 9in inter-floor distance for the majority of floors is accurate, then my scaling is fine.
Never going to be *perfect*, but I'd hazard a +/- 0.5% accuracy.
Shall dig it out. Kicking around in my piling system somewhere.Where is the camera position? Distance from the tower? What angle is the view from the location to the top of the WTC?
No, as long as it's made clear that perspective has not been accounted for it just adds an amount of potential error to results. Quite happy to include an estimation of the effect, but the data is still useful without applying perspective correction. For example, even the NIST Camera #3 footage analysis, which includes far higher levels of perspective, ignored perspective correction completely. I've made quite extensive treatment of my Cam#3 data to account for it. No problem doing so for the Dan Rather viewpoint, though suggest the difference will be marginal.The setup has to be specified or the data is worthless.
As Tom requested, please refrain from these more generalised kind of thought trains on this particular thread.Goes back to the prejudices of the persons jumping to conclusions.
No, the error margin is significantly amplified through derivation of acceleration data from noisy position/time data. What I hope results from this thread more than anything else is clear progression towards methods which deal effectively and accurately with significantly reducing the noise inherent in the raw data, making derived velocity and acceleration much more accurate.has the minute detailing simply reduced such error margin to a degree such that the margins are insignificant?
Perspective has not been taken account of, though it probably will be. It's omission does of course affect the *accuracy* of the data, though from the Dan Rather viewpoint I would suggest the effect is quite small. Modifiers would lekely be linear, so the *shape* of derived data should not be seriously affected.Do all of the positional points require no movement towards or away from the camera and that all movement be either vertical or lateral wrt to the videio frame? If the structure's measurement points were moving left/right and up/down then they were also moving front back and would not such movement, unmeasurable in a 2-d video rendering, affect the accuracy in the vertical measurements?