David Rodale
Muse
- Joined
- Jun 29, 2006
- Messages
- 680
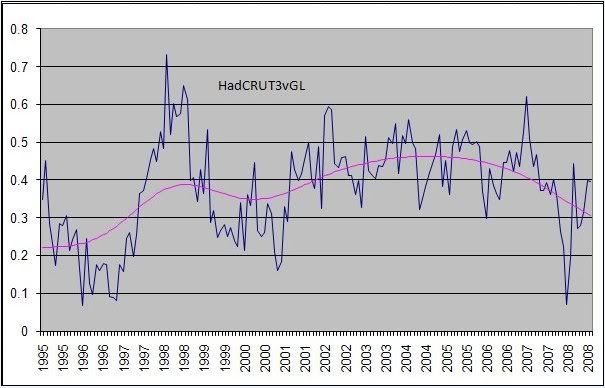
Not updated, I'm afraid, but here it is... the anomalies of the later months have been in the highs 0.4s, IIRC, but the 00's average is still 0.52.
http://www.internationalskeptics.com/forums/imagehosting/thum_2814805cd616042f.jpg
Still recycling the same pap?
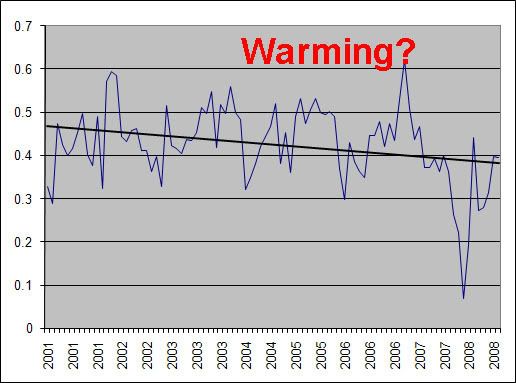
The problem is your graphs are stuck on long term trends, which is fine except that it says nothing about the current decade. It is laughable you're even bothering with it again. Come back in 6 months with the same nonsense. It was one year ago this month you and others laughed at the idea temperatures would drop.
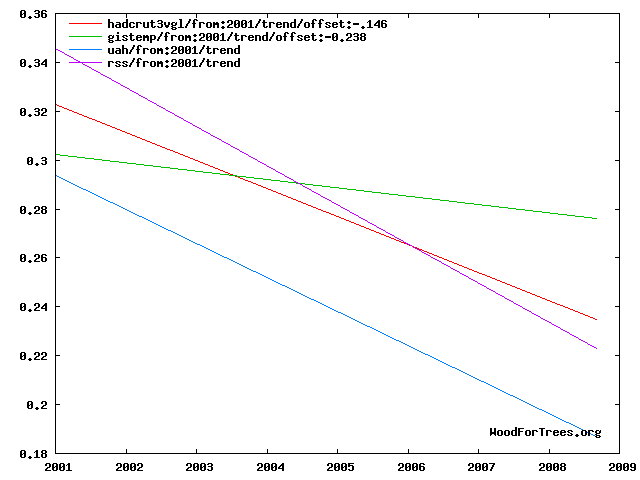
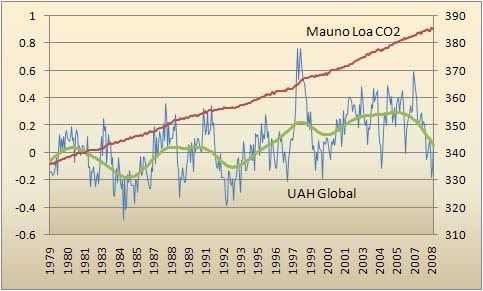
Very simply for the nth time:
Have fun convincing people it is still warming.
Last edited:
")


 .
.")