alienentity
Illuminator
- Joined
- Feb 21, 2009
- Messages
- 4,325
We obviously view images in a different way.
.....
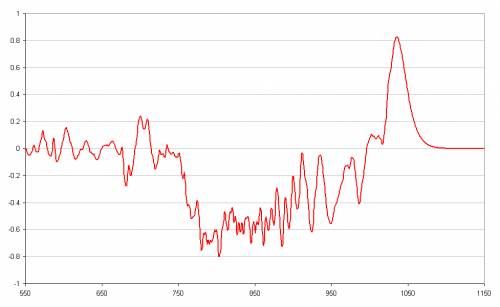
Behaviour of descent is the focus. From clearer details of behaviour over time, clearer details of mechanism can be determined...such as the implications for the significant over-g period.
If you see no value in revealing the very short period of time to reach g, and exceed it for a while, that's entirely up to you.
What's your estimate for the error bands of the data in m/s2? I think it may have been discussed but I can't remember what the number was.
")
") s). You on the other hand don't follow up with an explaination for your opinion.
s). You on the other hand don't follow up with an explaination for your opinion.") It's clear that the resultant profile is as accurate as has yet been presented.
It's clear that the resultant profile is as accurate as has yet been presented.