This will be my last response to
femr2 before I restore his contributions to their rightful place in my reading list.
As I explained in
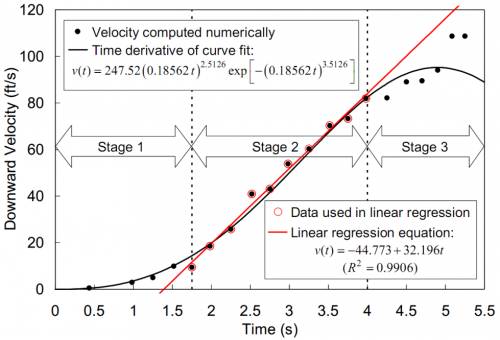
my most recent post, NIST section 12.5.3 uses a
nonlinear model with 3 parameters to describe the downward displacement of the north wall
Indeed, but a linear regression for acceleration.
This may come as quite a shock to you, but NIST's report was written for people who understand calculus. They will recognize what is implied by the formulas even if you don't.
I think the reason they didn't derive again is clear once you superimpose the resultant NIST acceleration curve atop one of mine. The inference of what you are saying is that the NIST acceleration curve is more accurate. As you can imagine, I don't agree.
You are drawing an incorrect inference. My calculations provide an objective measure of how well the modelled displacements matched your measurements. They provide only an indirect measure of the accuracy for acceleration, which (in this case) can only be inferred from the measured displacements.
It is an objective fact that during the first moments of WTC 7's collapse (between 11 and 13 seconds on your time scale), according to your own displacement data, using the standard sum of squares criterion, NIST's model is more accurate than your Poly(10) model.
Keeping those numbers to yourself is okay so long as your only purpose is to discuss vague trends, but you should not make any claims concerning the accuracy of your models without stating or publishing the numbers necessary to evaluate your claims properly.
I'm not *keeping those numbers to myself*. As I said, the tools I use will only output coefficients up to degree 16.
Yet you have kept the Poly(10) numbers to yourself, and they're for degree 10. At this point, you've spent more time defending your decision to keep those numbers to yourself than it would have taken to tell us what they are.
That was just yesterday. You were telling us that your polynomials must be better than NIST's approximations because (you thought) NIST's approximations were linear.
Which I hold to.
Of course you do.
Near the beginning of the collapse, where the "early gradient" makes a difference, your Poly(50) model would have performed even worse than your Poly(10) model because its slope is steeper and it intersects the zero-acceleration line at a later time than your Poly(10) model.
Which would have required you to reevaluate your personal choice of T0.
That's nonsense. I have not made any "personal choice of T0". The data are yours, the Poly(10) and Poly(50) models are yours, and NIST's model is theirs. The
only parameters for which I have had any choice are
- the parameters I had to reverse-engineer because you wouldn't reveal them
- the choice of 10.9 seconds as a reasonable offset between your time axis and NIST's
If you're unhappy with my reverse-engineered parameters, then the fault is yours for not revealing your numbers. You can repair that problem by revealing your numbers or by performing your own calculation. You have done neither.
My choice of 10.9 seconds cannot affect the computed accuracy of your model. A better choice for that offset can only improve the computed accuracy of NIST's model. Hence you cannot complain about that choice.
I find it eyebrow raising that you suggest the curve resulting from deriving the NIST velocity equation is a closer fit to ACTUAL motion.
Yet it is an objective fact that the model in NCSTAR 1-9 section 12.5.3 fits your own measurements of the NW corner's motion better than your own Poly(10) model during the interval between 11 and 13 seconds (your scale), when the collapse was beginning.
I invented one of the (less important) numerical algorithms your software is using.
Interesting. Which one ? What software do you mean ?
Any software that converts decimal scientific notation to binary floating point according to the standards set forth in
IEEE 754-2008,
XML Schema (W3C), the
Java Language Specification, ...
It is entirely reasonable for you to assume that I understand the consequences of increasing a fitting polynomial's degree.
Good. Then I suggest the Poly(50) curve would have been the better choice for your analysis.
Yet you cannot support your suggestion with actual numbers, because your Excel plug-in won't tell you what the relevant numbers are.
I have already explained why your Poly(50) model would have even more error near the beginning of the collapse than your Poly(10) model
Again, rather, you would have to rethink your T0.
You are talking nonsense. Calculating the residual sum of squares for your models does not involve any notion of a T0. If you understood that calculation, you would not be saying such silly things.
Run the numbers and find out, or tell me its numeric parameters and I'll find out for you. I've already told you what I think is likely to happen, but I could be wrong.
Am limited to output data at degree 16 with current software


I do not agree that *the NIST model(s)* provide greater accuracy.
Yet it is an objective fact that, during the interval from 11 to 13 seconds on your time scale, using your own measurements of the NW corner, using the objective criterion of least squares, NIST's model as described in section 12.5.3 is more accurate than your Poly(10) model.