Merged Discussion of femr's video data analysis

29.97
tfk is rounding up

,,,and PAL is 25 fps and cinema is 24 fps

My god. Spend about 30s (that's 30s +/- whatever you please) and look it up.

My TV (PAL) displays 50fps. Is yours in super-jerky-visionTM ? :)
 
Such arrogance, yet still wrong!


Priceless!

It's not arrogance at all. It's utter disbelief at the lack of understanding.

What's the refresh rate of your telly ?

Mine's 50Hz.

It displays 50 pictures per second.

PAL is 25i NTSC is 30i (actually 30*1000/1001)

The i refers to interlaced, not progressive.

Each frame contains two separate images...called fields...which are separated and displayed sequentially.

:rolleyes:
 
Do you have a definitive assessment of the various video compression algorithms to which this video has been subject?
Nope.

Do you know that none of those compression algorithms have employed earlier versions of "static motion elimination" thresholding, similar to h.264?
See above 'nope'.

In order to determine "X ±Y seconds", you first need to know "A ±B foot" positional accuracy.
Nope.

If you want to go there...

The NIST moire method *error analysis* suggests +/- 0.1 ft (+/- 1.2 inches) ...

655929457.png


...and I clearly have less noise in the data.

Apply a *tfk error analysis* as you see fit ;)

You've got your cart before your horse.
Incorrect.
 
Whilst NIST is on the slab...

NCSTAR 1-9 Vol 2 Appendix C - VIDEO ANALYSIS OF WTC 7 BUILDING VIBRATIONS BEFORE COLLAPSE

A few quotes:

  • The west edge of WTC 7 (to the right in the frame) was of the most interest in this analysis. This was the northwest corner of the building, which was clear of smoke throughout the recorded period.
  • From the camera’s perspective, the angle of this edge appears close to vertical.
  • The tripod mount kept fluctuations in viewpoint to a minimum, although they were not be negligible.
  • In the previous WTC 2 moiré analysis, frame-to-frame and slow motions of a tripod-mounted camera were found to be a source of error.
  • Due to the camera location, points on the north face near the northwest edge were closer to the camera than points near the northeast edge. However, this distortion was small, since the width of the north face was much smaller than the distance of WTC 7 from the camera.
  • The perspective view of the camera looking up at WTC 7 also introduced some error into the measurement of the number of pixels for the width, as did the uncertainty of a couple of pixels in the exact location of the edges defining the north face.
  • Given these sources of error, an estimate for this video of the width of the north face of WTC was 301 ± 4 horizontal pixels.
  • Since the true dimension of the north face was 329 ft, the conversion factor was 1.09 ft ± 0.02 ft per horizontal pixel. Combining this with the equivalence of 100 ± 10 vertical pixels for each horizontal pixel gave the final conversion factor of 1.1 ft ± 0.1 ft (13 in. ± 1 in.) for each 100 pixels of vertical marker motion.
  • To prepare for analysis, the video clip was exported into a sequence of images, with each image carrying the data for a single frame of the video. Each frame was then converted from the original RGB color into grayscale values.
  • One source of uncertainty in this analysis was the curve-fitting process; another arose from defects in the video images.
  • Many of the frames from this video contained defects, such as the color and black-and-white patterns in the lower center and lower left of Figure C-1. Similar defects occurring along the northwest edge being used for the analysis were responsible for some outlier points in the results.
  • To find the intersection point of the pixel intensity plots for these two pixel columns, the data for each column were first fitted to a smooth curve. A third-order polynomial least-squares fit gave a good compromise between the variance (a measure of the distance of each data point from the curve) and an estimate of the error in determining the intersection point.
  • Starting at about 6 s before the penthouse began its downward movement into the building, there was an abrupt change in the slope of the data that marked the beginning of oscillations that continue until collapse. There was also a second abrupt change in the data at about 1.5 s before the penthouse started moving downward.
  • there are major changes in the location of the marker point that occurred over long time intervals of 20 s or greater. These changes were likely due to movement of the camera.
  • Of primary interest in this analysis was any information that could shed light on the collapse sequence of WTC 7.

Tom,

If you have been following the detail of our *discussion*, it should be immediately clear to you why I have highlighted the quotes above.

If so, please state clearly why each is significant.

If not, say so, and I shall.
 
IIRC, femr2 says this because he believes he can utilize each feild as a full frame and thus refers to feilds as frames. Odd!


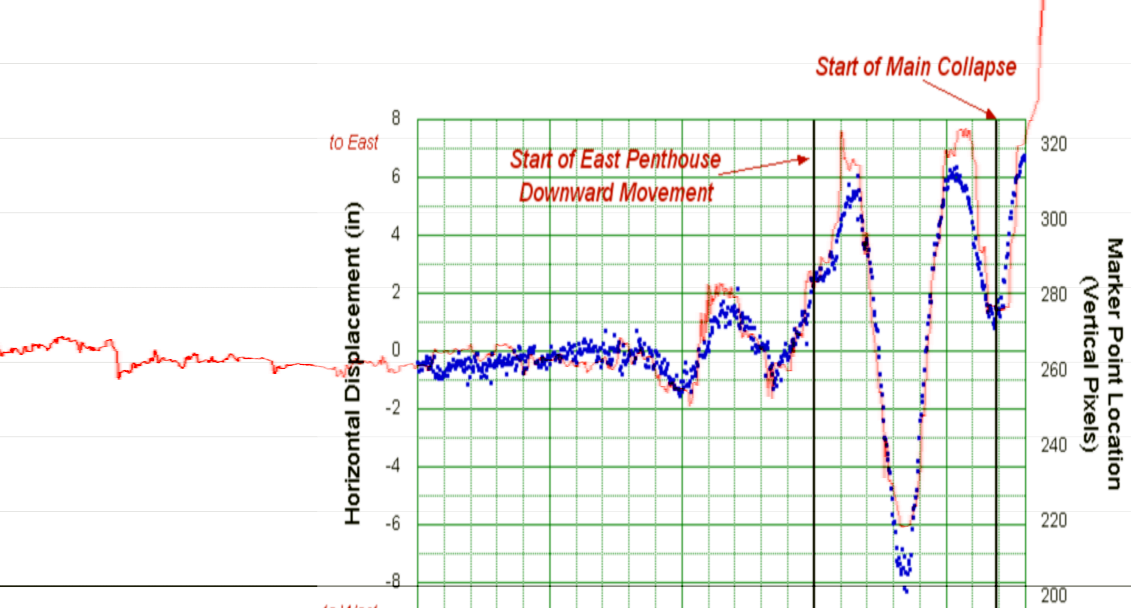
Well in that NIST puts this at 6 seconds and you have it at 7 seconds I see a potential difference in this of a full second which could either be because you have managed to deduce motion much more presisely than NIST OR you are out to lunch with your +/- 0.2 pixels OR your placement of t=0

However what does it matter? What are you trying to establish? That NIST was correct within a certain degree of accuracy in their FEA?
As I already said I , and every engineer worth the title, would already KNOW that the FEA will not be able to exactly mimic the actual collapse.

So, again, where are you going with this?

Here we go ‘round the mulberry bush
The mulberry bush, the mulberry bush
Here we go ‘round the mulberry bush
So early in the morning


http://www.songsforteaching.com/folk/herewegoroundthemulberrybush.htm
 
My god. Spend about 30s (that's 30s +/- whatever you please) and look it up.

My TV (PAL) displays 50fps. Is yours in super-jerky-visionTM ? :)

I did, twice now, once in my old college text book and here
http://www.paradiso-design.net/videostandards_en.html
2.2 PAL (Phase Alternating Line)

This format is used particularly in Western Europe, Australia, New Zealand and in some areas of Asia. PAL uses altogether 625 scan lines, thereof approx. 575 are visible. The color subcarrier has a frequency of approx. 4.43 MHz in the case of analog PAL (complementary view). Special NTSC or PAL color subcarrier signals will not be transferred via connections like SCART (RGB) and YUV. Such a signal is only transferred via connections like Composite Video, RCA, FBAS and Y/C or S-Video (S-VHS) respectively. The refresh rate is 25 Hz or 25 fps respectively. This corresponds to 50 Hz (interlaced) or 50 fields/s respectively.
.........
....The lines will be written from the left to the right starting with line 1. The first half-image is represented by the odd lines whereas the second half-image consists of all even lines. If we put these half-images together we get 25 frames per second on PAL.

its 50 fields (half images , half frames)per second

Care to try getting SECAM wrong too?
 
The i refers to interlaced, not progressive.
Each frame contains two separate images...called fields...which are separated and displayed sequentially.
AGAIN, a field is NOT a frame. A FIELD is NOT a complete image.
A complete image, raster, picture can only be produced using two (2, deux, one ananutter) fields.

If you ask a grocer for a dozen eggs and you are given 6 eggs I suppose you will be satisfied you have received what you asked for?
 
Last edited:
AGAIN, a field is NOT a frame. A FIELD is NOT a complete image.
A complete image, raster, picture can only be produced using two (2, deux, one ananutter) fields.

Oh. My. Many. Gods.

An interlaced frame contains two separate images, from two entirely different points in time.

Whilst those two images are part of an interlaced frame, they are indeed termed fields of that frame. Upper and lower, or odd and even, referring to the order of scanline interlace.

When those two separate images are separated from the interlaced frame, they are indeed half height, but they are two separate images. Two separate points in time.

Once those images are no longer part of an interlaced frame, you can call 'em whatever you please...frame, field, image, picture, ...

Any method of display which uses both fields at the same time is simply a compromise route to deliver as much vertical resolution as possible, but it STILL contains two separate images from two separate points in time.

You CANNOT produce a complete raster image of a single point in time for a frame which contains ANY movement at all, as each field contains a DIFFERENT image, from a different point in time.

It's really very simple.

Again...

http://www.100fps.com/

Read it this time.
 
Last edited:
If you ask a grocer for a dozen eggs and you are given 6 eggs I suppose you will be satisfied you have received what you asked for?
In context...

What I'd be given is TWO separate boxes of eggs (two separate fields), with 6 eggs in each box, and they'd be given to me in a plastic bag container to keep them together (a frame).

One box could be Chicken eggs, the other could be Quail eggs.

It's important to keep your chicken separate from your quail of course.

Except of course that you are trying (to extend the metaphor) make two 12 egg omlettes from two groups of 6 eggs.

A field is MISSING half of the image. Its not just missing half the resolution, its actually not scanned half the image, that half is in the next field.
New metaphor;
If I snap a series of photos of a tree from top to bottom with each photo containing 1 vertical foot of the tree but I do not bother with every even numbered foot of tree I WILL NOT have a complete picture of the tree and simply cannot make precise predictions about the blank spots. If I then move back to the top and start again this time taking pics of only the even numbered intervals I am not going to be able to precisely predict what's happening in the odd intervals at this time.

You continue to treat each field as if its a complete image.
It simply isn't.
 
An interlaced frame contains two separate images, from two entirely different points in time.

Whilst those two images are part of an interlaced frame, they are indeed termed fields of that frame. Upper and lower, or odd and even, referring to the order of scanline interlace.

When those two separate images are separated from the interlaced frame, they are indeed half height, but they are two separate images. Two separate points in time.

.

JEEBUS Kristoes
They are not "half height"!
They are images at full height with MISSING lines of information
 
Except of course that you are trying (to extend the metaphor) make two 12 egg omlettes from two groups of 6 eggs.
Incorrect.

A field is MISSING half of the image. Its not just missing half the resolution, its actually not scanned half the image, that half is in the next field.
Incorrect.

If I snap a series of photos of a tree from top to bottom with each photo containing 1 vertical foot of the tree but I do not bother with every even numbered foot of tree I WILL NOT have a complete picture of the tree and simply cannot make precise predictions about the blank spots. If I then move back to the top and start again this time taking pics of only the even numbered intervals I am not going to be able to precisely predict what's happening in the odd intervals at this time.

You continue to treat each field as if its a complete image.
It simply isn't.
Incorrect.
 
JEEBUS Kristoes
They are not "half height"!
They are images at full height with MISSING lines of information
They are two images from two separate points in time.

In the contect of detecting movement, they CANNOT both be used at the same time.

To give you something...some video is interlaced by the capture of two separate full height images and alternating between each image on each scanline. That is what you are referring to. However, the VAST majority of video simply rescales each captued image to half height, or even CAPTURES them with the appropriate aspect ratio...ergo...the detail was never there in the first place.


The CRITICAL point here, however, is...if you are in an arena where you are not looking at movement, fine, keep the full frame with both fields, but...

As soon as you want to detect movement, you MUST separate them.

I trace each field separately by the way.

You can argue about it as much as you like.

My methods are absolutely correct on this front.

Interlaced video with a framerate of 29.97 frames per second contains 59.94 images per second, and I use them all.
 
Or something specific...a frame direct from one of the well known WTC 7 videos...

556666931.png


Could you tell me the location of the NW corner please ? :rolleyes:
 
Interlaced video with a frame-rate of 29.97 frames per second contains 59.94 half images (frames) per second, and you use them all to accomplish nothing to do with 911 CTs, no goals.
 
FWIW, the whole discussion on the frame rate boils down to what the sampling rate of the data that ferm2 has provided is, and that's ~60 Hz.

Data is sampled (by the camera) at 60 Hz, then scaled down, then encoded, two frames at a time, into interlaced frames, then stored or transmitted as a 30 Hz stream; femr2 then reverses the encoding to obtain a 60 Hz stream, which he uses to draw the data from. This is an overview, some of the details are or can be different.
 
tfk said:
You don't even know how to interpret your own results.
Care to provide an example ?

LoL.
If you had the simply kept reading, you would have read it. Oh, you DID read it, and still didn't understand.

Allow me to spoon-feed you your own data.
(Keep reading now, while I reiterate the conversation.)

tfk said:
You've posted your (over filtered) acceleration vs time graph.
Which one ?

This one.

picture.php

which is your image from here: http://femr2.ucoz.com/_ph/7/508127617.png

You said in the last post that this data had long since demonstrated free fall. And that you stand by that statement today.

And yet, the blue line on the graph below shows free fall.
picture.php


Explain to be again how "you stand by your previous statement that the data has 'long since proven free fall'."

Or play dumb again. It's what you do well...

From the man who wrote...

tfk said:
Using difference equations,
v = (h2 - h1) / (t2 - t1).

the error in t2 - t1 is insignificant compared to the height error. (a good, real approximation, in this case).

If you have two points that are taken 1 second apart, and they measure equal heights, with an error of ±1 foot, then the error in the calculated velocity is

v = 0 ft/sec
V error = ± 1 ft/sec

If you maintain the very same height error, but your sampling rate is now 60 frames per second, then then

v = 0 ft/sec
V error = (±1 foot) / .0167 sec = ± 60 ft/sec.

+/- 60 ft/sec. Priceless.


Math is not your friend, is it? LOL.

Here, let me draw you a pitcha…

picture.php


On this graph, I've charted 3 data points as they SHOULD be drawn: with their error bars shown. The {time, height ±error} values are {0 seconds, 0 ±1 ft}, {.0167 sec, 0 ±1 ft} & {1 sec, 0 ±1 ft}. Note that the 3rd point is way off of the graph to the right. Note also that each point shows the ±1 foot error bar.

The second situation that I described above is shown with points 1 & 2. "Two points, equal height (0 ft in this case), taken 1/60 (i.e., 0.0167) seconds apart, with a ±1 foot error band." The blue and pink diagonal lines show the min & max velocities that these two data points can rigorously assert. The empirical equation is overlaid on each line.

The first situation that I describe above is shown with points 1 & 3. "Two points, equal height (0 ft in this case), taken 1 second apart, with a ±1 foot error band." The green and orange diagonal lines show the min & max velocities that these two data points can rigorously assert. The empirical equation is overlaid on each line.

In both of these cases (the 1/60th second data rate & the 1 second data rate), the average velocity is clearly zero.

Now femr, let me ask you a question about error analysis...

What you think that the numbers "-120" & "120" mean in the pink & blue empirical equations, which are associated with the 1/60 second data interval?

What do you think that the numbers "-2" & "2" mean in the orange & green empirical equations, which are associated with the 1 second data interval?

Those numbers mean 4 things:

1. the principle that I was describing is precisely correct.
2. I shouldn't do the math in my head, but should draw a sketch. Because I underestimated the velocity error by a factor of 2.
3. the correct numbers are: your velocity uncertainty (i.e., error band) for the 1 second interval is really ±2 ft/sec. The velocity uncertainty for the 1/60th second interval is ±120 ft/sec.
4. Your "priceless" comment is, well, priceless. You don't know WTF you are talking about. You are innumerate. "numerically illiterate".

Given a constant position error, the uncertainty in your velocity calculations increases dramatically simply because you take data at a higher rate. Which is exactly what I said.

This is exactly how error analysis works.

Tom

PS I assume you'll not be using the data any more. That's fine. I assume you don't ascribe any validity to the graphs you've created from it. That's fine. I assume you'll be removing them and using data from Chandler instead.

As usual, you assume wrong. On all points.

If you were observant (yeah, & if pigs could fly), you might have noticed a strong similarity between the words "public" & "publish". Ever wonder about that?

You published your data. Darned sporting of you, old chap.

It ain't "your data" any more.

Any more than the data in the NIST report "belongs" to NIST. That's what "public domain" means.

I'll be using & citing your published data. You don't have any more right to restrain my use of your published data than NIST has to restrain your use of their published data.

Tough mammary appendage...
 
Last edited:

Back
Top Bottom